

The Daily Decision for 5.29.18 - Time To Dust Off The Euro-Crisis Playbook?
The State of the Markets:
Good morning and welcome back. One of the great things about taking some time away from the keyboard and your daily routine is it gives you time to reflect on the big picture stuff as well as what you are doing on a daily basis. On the latter, I've decided to try and make my weekly indicator summary more of an "executive summary" of my work - I.E. I believe "less is more" here. I sincerely hope you like the format.
Turning to the markets, anyone looking for to ease back into the game this morning will be sorely disappointed. The word "contagion" is back this morning as political instability in Italy is causing big problems for markets both across the pond and here at home. At issue is Italy's massive debt load, the poor performance of the eurozone's third largest economy, and the inability of the elected officials to form a government.
The key is that when coupled with the no-confidence vote for Spain's prime minister slated for Friday, talk of the eurozone breaking apart has returned.
In short, Italy remains without a government and is looking at another round of snap elections, which analysts believe would likely morph into a referendum on Italy remaining in the eurozone. The fear, of course, is that anti-euro sentiment could become a big problem in Italy, and then Spain, and so on, and so on.
The effect of the political chaos can be seen clearly in European bond markets. For example, the yield on Italy's 10-yield note has soared from 0.3% to over 2.5% - this week. And with investors dusting off their "euro-crisis" playbooks, stocks and the euro are being sold, the dollar is rising, and U.S. bonds are seeing a safe haven bid as the yield on the 10-year is moving back below 2.9% this morning.
The question of the day is if traders in the U.S. will ignore the strong economic footing here at home and return to the euro-crisis playbook last seen in 2011 by freaking out over the "what if" scenarios of the day overseas. So far at least, it looks like stocks are heading lower at the open and bond yields are moving back to levels many analysts didn't expect to see again any time soon.
Stay tuned, this is definitely going to be interesting.
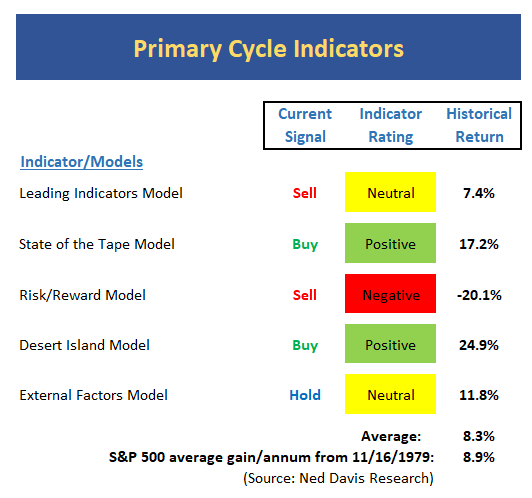
The State of the Big-Picture Market Models
I like to start each week with a review of the state of my favorite big-picture market models, which are designed to tell me which team is in control of the prevailing major trend.
View My Favorite Market Models Online
The Bottom Line:
- I apologize for sounding like a broken record here, but my bottom line "take" on the state of the market is this remains a corrective/consolidation phase. And the current euro freak-out will likely cement the idea of a trading range - or worse - in the near-term. However, the historical returns of the "primary cycles" models (which currently sport an average annualized rate of return of 8.3% vs. the S&P's average of 8.9% since late 1979) tell me to continue to give the bulls some room and look for an upside resolution of this phase. And while I'm not at all pleased to see two of my top five models on sell signals, the overall message of this key indicator board seems to be that stocks are likely to "muddle through." As such, it makes sense to stay the course here. Unless additional model weakness develops, of course.
The State of the Trend
Digging into the details, I like to start my weekly review with a look at the "state of the trend." These indicators are designed to give us a feel for the overall health of the current short- and intermediate-term trend models.

View Trend Indicator Board Online
The Bottom Line:
- The short-term trend is sideways, but the longer-term indicators are in pretty good shape - advantage bulls.
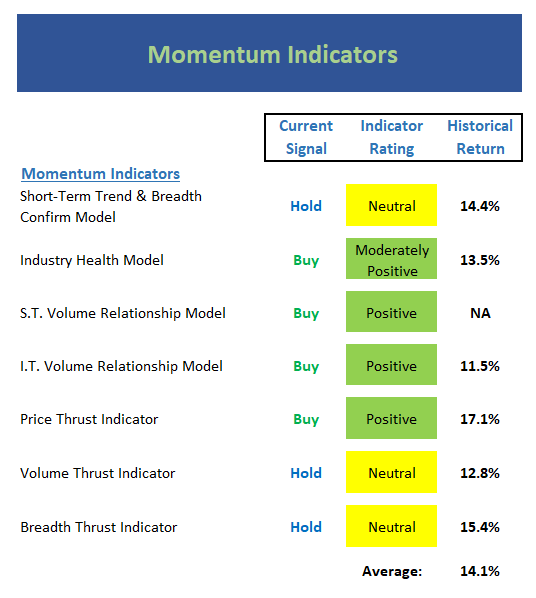
The State of Internal Momentum
Next up are the momentum indicators, which are designed to tell us whether there is any "oomph" behind the current trend.
View Momentum Indicator Board Online
The Bottom Line:
- Momentum indicators are actually in darn good shape with the average return well above the historic mean - advantage bulls.
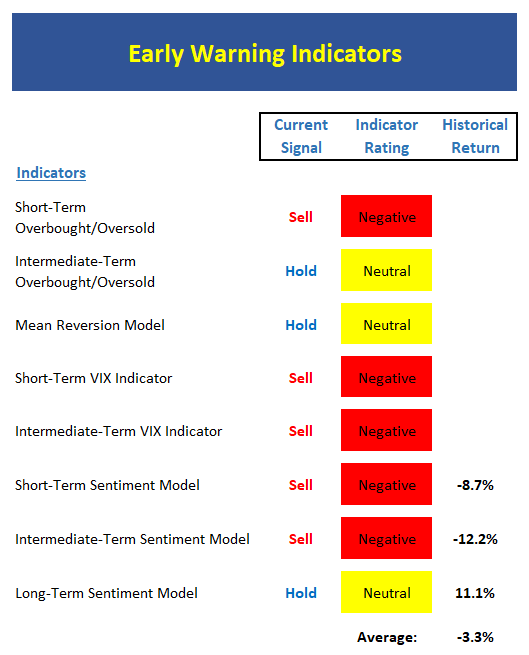
The State of the "Trade"
We also focus each week on the "early warning" board, which is designed to indicate when traders might start to "go the other way" -- for a trade.
View Early Warning Indicator Board Online
The Bottom Line:
- Stocks are overbought and sentiment is back to negative - advantage bears (for the near-term).
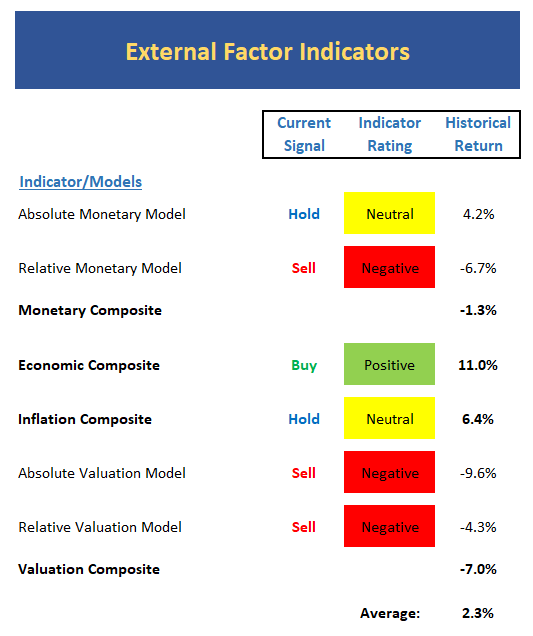
The State of the Macro Picture
Now let's move on to the market's "external factors" - the indicators designed to tell us the state of the big-picture market drivers including monetary conditions, the economy, inflation, and valuations.
View External Factors Indicator Board Online
The Bottom Line:
- I have redesigned the External Factors board to make the message easier to receive. In sum, monetary conditions aren't great, economic indicators are strong, the inflation picture is okay, and valuation models remain negative - neither team has a clear edge here.
Dynamic Asset Allocation Model
Below is an EXAMPLE of how one might utilize the indicator boards in a portfolio. The idea is to determine the appropriate equity allocation for a balanced, dynamic asset allocation model with a base target of 60/40 stocks/bonds.
The overall intent of the model is to keep equity exposure in line with current conditions. Since the model is updated monthly, we take a longer-term approach and allocate 40% of the exposure to Environmental factors, 40% to Trend and Momentum factors, and 20% to Sentiment.
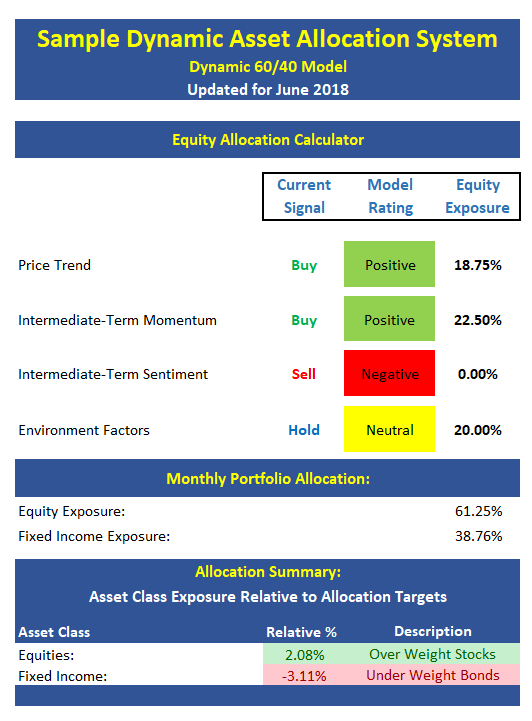
The model above is for illustrative and informational purposes only and does not in any way represent any investment recommendation. The model is merely a sample of how indicators can be grouped to create a guide to market exposure based on the inputs from multiple indicators/models.
Thought For The Day:
Strength does not come from physical capacity. It comes from an indomitable will. -Mahatma Gandhi
Wishing you green screens and all the best for a great day,

David D. Moenning
Founder, Chief Investment Officer
Heritage Capital Research
HCR Focuses on a Risk-Managed Approach to Investing
Must Read: What Risk Management Can and Cannot Do
HCR's Financial Advisor Services
HCR's Individual Investor Services
Questions, comments, or ideas? Contact Us
At the time of publication, Mr. Moenning held long positions in the following securities mentioned: none - Note that positions may change at any time.
Today's Model Review:
LEADERS Model: The LEADERS currently holds 20% positions in the Consumer Discretionary, Technology, Health Care, Financials, and Energy sectors.
CORE Model (Risk Managed Exposure):
Today's CORE model's exposure target: 55%
Current CORE Model exposure: 75%
To review, the goal of this model is to stay in tune with the overall risk/reward environment. Therefore, we make adjustments only when there is a meaningful and sustained divergence between the target model reading and our current positions.
TRADING Model: We currently hold trades in gold, commodities, global technology, and the internet sector.
2018 YTD Performance Update:
DD LEADERS: +3.6%
S&P 500: +1.8%
| Daily Decision Trading Service
Current Portfolio Summary | ||||||
| The LEADERS Model | ||||||
Position | ETF Symbol | % of Model | Date Purchased | Purchase Price | Current Rating | |
| Technology Select Sector SPDR | XLK | 20% | 12.1.16 | $46.64 | Hold | |
| Health Care Select Sector SPDR | XLV | 20% | 11.27.17 | $81.79 | Buy | |
| Consumer Discretionary Select Sector SPDR | XLY | 20% | 2.9.18 | $99.67 | Buy | |
| Financials Select Sector SPDR | XLF | 20% | 2.12.18 | $27.94 | Buy | |
| Energy Select Sector SPDR | XLE | 20% | 5.2.18 | $73.57 | Hold | |
| The CORE EXPOSURE Model | ||||||
Position | ETF Symbol | % of Model | Date Purchased | Purchase Price | Current Rating | |
| SPDR S&P 500 ETF | SPY | 37.5% | 4.17.18 | $269.78 | Buy | |
| iShares S&P Small-Cap | IJR | 37.5% | 4.17.18 | $79.83 | Buy | |
| Cash | NA | 25.0% | NA | $1.00 | Hold | |
| The TRADING Model | ||||||
Position | ETF Symbol | % of Model | Date Purchased | Purchase Price | Current Rating | |
| PowerShares Commodity Index ETF | DBC | 25% | 5.2.18 | $17.43 | Buy | |
| First Trust Internet Index | FDN | 25% | 2.26.18 | $124.00 | Hold | |
| iShares Global Technology | IXN | 25% | 2.26.18 | $165.40 | Hold | |
| SPDR Gold Shares | GLD | 25% | 4.17.18 | $127.27 | Buy | |
% of Model Explained
The number shown in this column represents the percentage of the the model this position represents.
Current Rating Explained
This is our rating for the day. The Current Rating tells you what action we would take if we did not currently hold the position. A "Buy" rating means we would be willing to purchase the position at current prices. A "Strong Buy" suggests this would be our first choice to buy. A "Hold" rating indicates we would not make new purchases at current levels. And a "Sell" rating indicates we will likely exit the position in the near-term.
Positions Can Change
Positions often change during the trading session. Remember that we will send a Trade Alert via SMS Text Message and/or Email BEFORE we ever make a move in the models.
About the Daily Decision Models:
The Daily Decision is designed to be a simple, easy-to-follow e-letter service showcasing 3 different model portfolios. The LEADERS model is the flagship, growth oriented strategy that focuses on "where the action is" in terms of market leadership. The CORE model is a longer-term, risk-managed approach to keeping exposure to market risk in line with prevailing conditions. And as the name implies, the TRADING model is intended to be a tactical, opportunistic trading strategy.
Disclosure: At the time of publication, Mr. Moenning held long positions in the following securities mentioned: SPY, IJR XLK, XLV, XLY, XLF, DBC, FDN, IXN, GLD Note that positions may change at any time.
Wishing You All The Best in Your Investing Endeavors!
The Front Range Trading Team
Daily Decision Links:
Daily Decision Resource Page
Interactive Performance Details
NOT INVESTMENT ADVICE. The analysis and information in this report and on our website is for informational purposes only. No part of the material presented in this report or on our websites is intended as an investment recommendation or investment advice. Neither the information nor any opinion expressed nor any Portfolio constitutes a solicitation to purchase or sell securities or any investment program. The opinions and forecasts expressed are those of the editors and may not actually come to pass. The opinions and viewpoints regarding the future of the markets should not be construed as recommendations of any specific security nor specific investment advice. Investors should always consult an investment professional before making any investment.
Recent free content from FrontRange Trading Co.
-
 The Lines In The Sand Are Clear
— 9/16/20
The Lines In The Sand Are Clear
— 9/16/20
-
The Question of the Day
— 8/04/20
-
Portfolio Update: 1.23.20
— 1/23/20
-
State of the Markets: Modeling 2020 Expectations (Just For Fun)
— 1/13/20
-
Current Holdings for ALL-NEW 2020 Daily Decision Model Portfolio
— 1/03/20
