

Indicators Showing Signs of Improvement, But...
Good Monday morning and welcome back. We made it through the ECB meeting, the UK election, and Comey's eye-opening testimony last week and well, the major indices are none the worse for wear. Next up is this week's Fed announcement (where Yellen's gang is expected to raise rates another 25 basis points). In addition, there is the question if Friday's tech wreck will continue. From my seat, it appears that Goldman's "negative Nancy" view on tech sparked some much-needed profit taking in the big tech names. And while the selling could easily continue for a couple more days, let's keep in mind that end of quarter "window dressing" (which is technically illegal) tends to be a powerful thing. So, we would not at all be surprised to see some dip buying come in during what appears to be (well, so far at least) a garden variety pullback in the market's technology darlings.
Since it's the start of a new week, let's get right to our objective review the key market models and indicators. To review, the primary goal of this weekly exercise is to remove any subjective notions and ensure that we stay in line with what "is" happening in the markets. So, let's get started...
The State of the Trend
We start each week with a look at the "state of the trend." These indicators are designed to give us a feel for the overall health of the current short- and intermediate-term trend models.
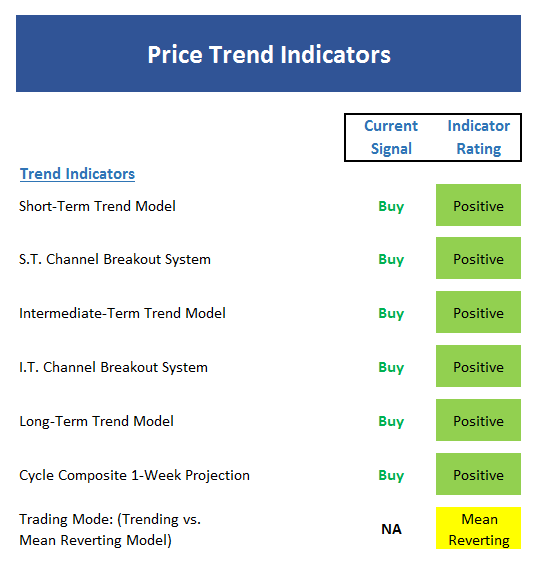
View Trend Indicator Board Online
Executive Summary:
- The short-term Trend Model remains positive, but only modestly so. A close below Friday's low would turn this model negative.
- The short-term Channel Breakout System is on a buy signal. A close below 2403 would reverse the indicator to sell.
- The intermediate-term Trend Model is solidly positive.
- The intermediate-term Channel Breakout System is also on a buy and remains so unless the S&P closes below 2352 this week.
- The long-term Trend Model is squarely positive.
- The Cycle Composite continues to point higher for the next two weeks.
- The Trading Mode models are starting to waver. One out of the three flipped to "trending" last week, but this model requires two out otf three to confirm.
- In sum, the price models are still positive, but are not as strong as they were last week.
The State of Internal Momentum
Next up are the momentum indicators, which are designed to tell us whether there is any "oomph" behind the current trend...
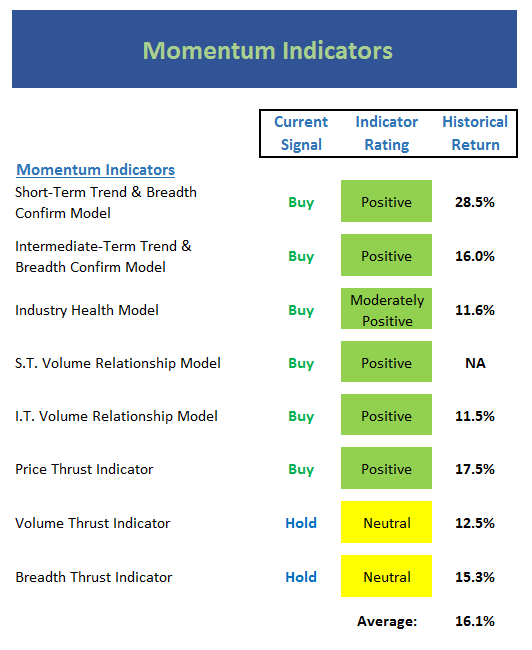
View Momentum Indicator Board Online
Executive Summary:
- The short-term Trend and Breadth Confirm Model is still positive.
- The intermediate-term Trend and Breadth Confirm Model has been solidly positive for some time.
- The Industry Health Model improved enough to nudge its way into the green zone this week. However, do not confuse this with an outright positive reading.
- The short-term Volume Relationship is positive but only by the slimmest of margins
- The intermediate-term Volume Relationship remains positive
- The Price Thrust Indicator is in the lower reaches of the positive zone
- The Volume Thrust Indicator has moved back into the neutral zone
- The Breadth Thrust Indicator is also neutral
- The status of the "thrust" indicators tell the story here…
The State of the "Trade"
We also focus each week on the "early warning" board, which is designed to indicate when traders may start to "go the other way" -- for a trade.
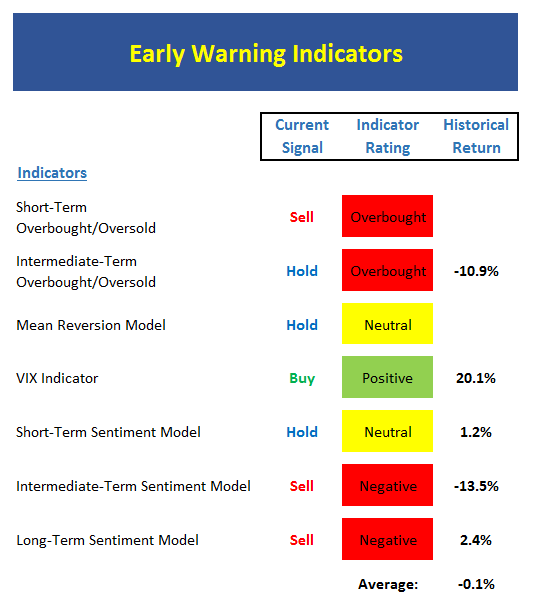
View Early Warning Indicator Board Online
Executive Summary:
- From a near-term perspective, the market has triggered an overbought sell signal. However, this would require confirmation from other indicators before being taken seriously.
- From an intermediate-term view, stocks are once again overbought. However, a sell signal occurs when an extreme overbought condition is first achieved and then reversed.
- The Mean Reversion Model remains in never-land.
- The VIX is positive from an intermediate-term perspective and negative from the short-term view.
- From a short-term perspective, market sentiment remains neutral
- The intermediate-term Sentiment Model hasn't budged and is negative
- Longer-term Sentiment readings are also very negative
The State of the Macro Picture
Now let's move on to the market's "external factors" - the indicators designed to tell us the state of the big-picture market drivers including monetary conditions, the economy, inflation, and valuations.
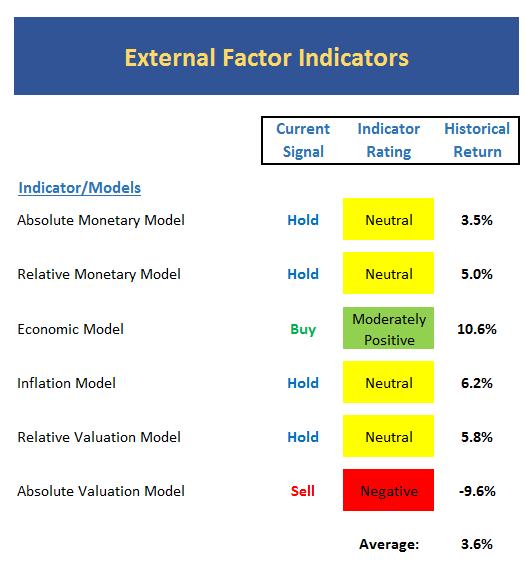
View External Factors Indicator Board Online
Executive Summary:
- Absolute Monetary conditions remain neutral.
- On a relative basis, our Monetary Model continues to improve with the neutral zone.
- After being on the wrong side of the market for a very long time, our Economic Model (designed to call the stock market) has finally gotten back in sync and flashed a buy signal
- The Inflation Model continues to move lower in the neutral zone. This tells us inflation risks have diminished considerably of late.
- Our Relative Valuation Model has upticked ever-so slightly in the last few weeks but remains neutral.
- The Absolute Valuation Model remains solidly negative.
The State of the Big-Picture Market Models
Finally, let's review our favorite big-picture market models, which are designed to tell us which team is in control of the prevailing major trend.
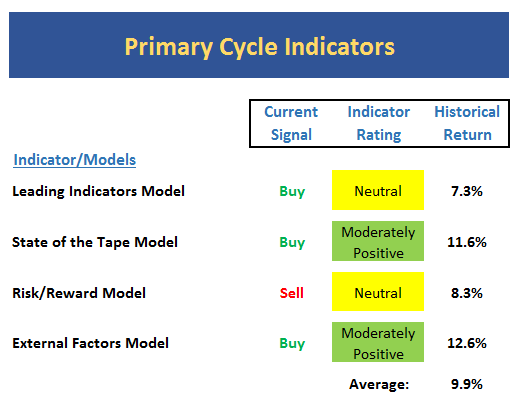
View My Favorite Market Models Online
Executive Summary:
- The Leading Indicators model, which did a fine job during the last bear phase, flashed a buy signal two weeks ago. However, the model reading itself slipped back into the neutral zone last week.
- The Tape has improved modestly but is not as strong as we'd like at this stage.
- The most recent signal from the Risk/Reward model is sell. However, the model reading itself is now neutral.
- The External Factors model has upticked into the moderately positive zone, but only by a slim margin.
The Takeaway...
The good news is we have seen some improvement in several of our key market models. For example, the Leading Indicators, State of the Tape, and External Factors Models are all back in the green this week. However, (1) all three big-picture models are only slightly in the positive zone (hence the "moderately positive" ratings) and (2) the "thrust" models have not triggered fresh buy signals during the current move. In addition, the news flow and the cycle composite seem favorable here. So, this combination tells me that while it is probably best to favor the bulls at this time, we are not in a "no brainer" uptrend. So, while I hate to sound like a broken record, this is not a low-risk environment and one should play the game accordingly. For me this means utilizing a "lower risk profile" approach and remaining alert for a change in the trend.
Thought For The Day:
"The secret of getting ahead is getting started." - Mark Twain.
Current Market Drivers
We strive to identify the driving forces behind the market action on a daily basis. The thinking is that if we can both identify and understand why stocks are doing what they are doing on a short-term basis; we are not likely to be surprised/blind-sided by a big move. Listed below are what we believe to be the driving forces of the current market (Listed in order of importance).
1. The State of Trump Administration Policies
2. The State of the U.S. Economy
3. The State of Earning Growth
Wishing you green screens and all the best for a great day,

David D. Moenning
Chief Investment Officer
Sowell Management Services
Disclosure: At the time of publication, Mr. Moenning and/or Sowell Management Services held long positions in the following securities mentioned: none. Note that positions may change at any time.
Looking for a "Modern" approach to Asset Allocation and Portfolio Design?
Looking for More on the State of the Markets?
Disclosures
The opinions and forecasts expressed herein are those of Mr. David Moenning and may not actually come to pass. Mr. Moenning's opinions and viewpoints regarding the future of the markets should not be construed as recommendations. The analysis and information in this report is for informational purposes only. No part of the material presented in this report is intended as an investment recommendation or investment advice. Neither the information nor any opinion expressed constitutes a solicitation to purchase or sell securities or any investment program.
Any investment decisions must in all cases be made by the reader or by his or her investment adviser. Do NOT ever purchase any security without doing sufficient research. There is no guarantee that the investment objectives outlined will actually come to pass. All opinions expressed herein are subject to change without notice. Neither the editor, employees, nor any of their affiliates shall have any liability for any loss sustained by anyone who has relied on the information provided.
The analysis provided is based on both technical and fundamental research and is provided "as is" without warranty of any kind, either expressed or implied. Although the information contained is derived from sources which are believed to be reliable, they cannot be guaranteed.
David D. Moenning is an investment adviser representative of Sowell Management Services, a registered investment advisor. For a complete description of investment risks, fees and services, review the firm brochure (ADV Part 2) which is available by contacting Sowell. Sowell is not registered as a broker-dealer.
Employees and affiliates of Sowell may at times have positions in the securities referred to and may make purchases or sales of these securities while publications are in circulation. Positions may change at any time.
Investments in equities carry an inherent element of risk including the potential for significant loss of principal. Past performance is not an indication of future results.
Advisory services are offered through Sowell Management Services.
Recent free content from FrontRange Trading Co.
-
 Is The Bull Argument Too Easy These Days?
— 8/31/20
Is The Bull Argument Too Easy These Days?
— 8/31/20
-
What Do The Cycles Say About 2020?
— 1/21/20
-
Modeling 2020 Expectations (Just For Fun)
— 1/13/20
-
Tips From Real-World Wendy Rhoades
— 5/06/19
-
The Best Recession Ever!
— 4/29/19
-
{[comment.author.username]} {[comment.author.username]} — Marketfy Staff — Maven — Member


- 1 Campus Martius, Suite #200Detroit, MI 48226
- +1 877 440 9464