

Bulls In Charge, But Where's The Beef?
Good Monday morning and welcome back. A third terror attack in London in as many months, Wednesday's general election in the U.K., this week's meeting of the ECB, the isolation of Qatar (and the corresponding impact on oil), next week's Fed meeting, and this week's testimony of former FBI Director, James Comey are in focus this morning. While it is likely to be a busy week, so far at least, stock futures in the U.S. do not appear to be overly worried.
Since it's the start of a new week, let's get right to our objective review the key market models and indicators. The primary goal of this exercise is to remove any subjective notions and ensure that we stay in line with what "is" happening in the markets. So, let's get started...
The State of the Trend
We start each week with a look at the "state of the trend." These indicators are designed to give us a feel for the overall health of the current short- and intermediate-term trend models.
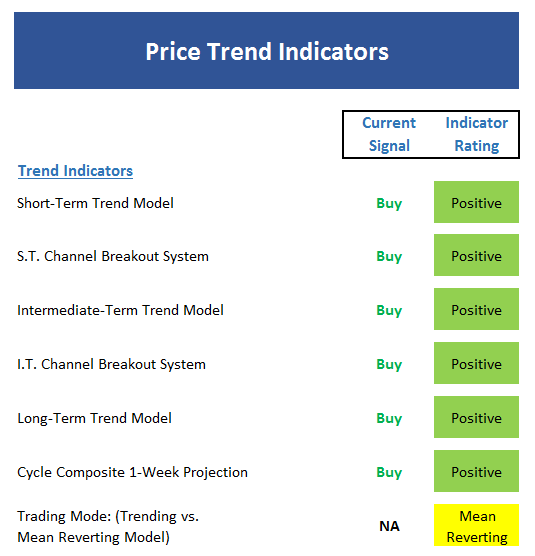
View Trend Indicator Board Online
Executive Summary:
- With the S&P at new all-time highs, it should come as no surprise that the short-term Trend Model is flashing green here
- The short-term Channel Breakout System is on a buy signal
- The intermediate-term Trend Model is also a lovely shade of green
- The intermediate-term Channel Breakout System is positive
- The long-term Trend Model remains solidly positive
- The Cycle Composite points to higher prices next week
- The Trading Mode models have yet to confirm the recent breakout. While concerning, this can be rectified in time.
The State of Internal Momentum
Next up are the momentum indicators, which are designed to tell us whether there is any "oomph" behind the current trend...
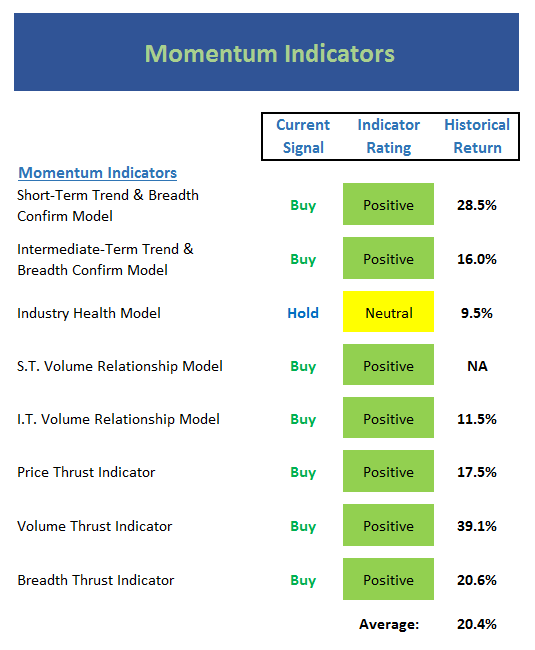
View Momentum Indicator Board Online
Executive Summary:
- The short-term Trend and Breadth Confirm Model has moved back into positive zone.
- Our intermediate-term Trend and Breadth Confirm Model has remained steadfastly positive for some time now.
- The Industry Health Model slipped back to neutral. However, the indicator has been flip-flopping between neutral and moderately positive lately.
- The short-term Volume Relationship is positive, but not by a large margin.
- The intermediate-term Volume Relationship did a good job of telling us to maintain some long exposure recently and remains positive
- The Price Thrust Indicator moved back into the positive zone, which confirms the recent move to new highs.
- The Volume Thrust Indicator moved into the positive zone but has not flashed a new "thrust" buy signal.
- Ditto for the Breadth Thrust Indicator- positive, but no oomph signal (yet).
- It is worth nothing that we have not seen any "thrust signals" accompanying the breakout to new highs. Typically, one of our breadth thrust signals signals the start of a new leg higher. However, stocks do tend to gain ground at a good clipl when the momentum indicators are positive.
The State of the "Trade"
We also focus each week on the "early warning" board, which is designed to indicate when traders may start to "go the other way" -- for a trade.

View Early Warning Indicator Board Online
Executive Summary:
- From a near-term perspective, stocks are once again overbought. However, it looks like another "good overbought" condition is developing.
- From an intermediate-term view, stocks are also now overbought.
- The Mean Reversion Model remains neutral but the model is close to a sell signal.
- The Intermediate-term VIX Indicator remains on a buy signal, but the shorter-term version flashed a sell last week as the VIX is once again near the lows for the year.
- From a short-term perspective, market sentiment remains neutral
- No change. The intermediate-term Sentiment Model remains solidly negative as the market is displaying a large amount of complacency.
- Longer-term Sentiment readings are also overly optimistic
The State of the Macro Picture
Now let's move on to the market's "external factors" - the indicators designed to tell us the state of the big-picture market drivers including monetary conditions, the economy, inflation, and valuations.
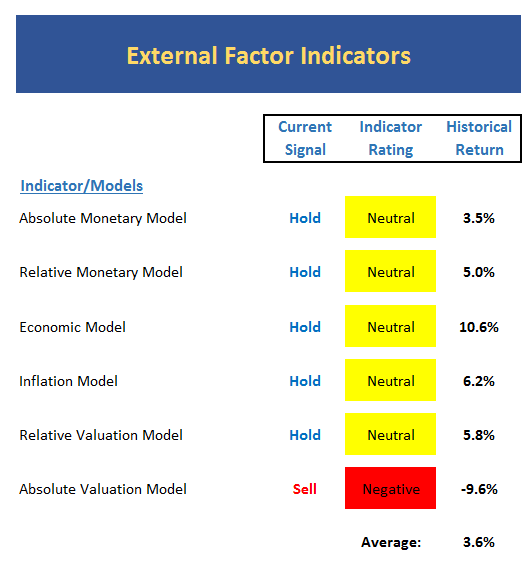
View External Factors Indicator Board Online
Executive Summary:
- Absolute Monetary conditions remain neutral but are improving.
- On a relative basis, our Monetary Models are also neutral
- Our Economic Model (designed to call the stock market) upticked recently into the neutral zone. This indicator continues to be out of whack with market conditions, but it does seem to be improving.
- The Inflation Model is now solidly neutral. This tells us inflation is not overheating at this time.
- After recently hitting the lowest levels since 2010, our Relative Valuation Model is moving up within the neutral zone here.
- The Absolute Valuation Model remains negative but has improved ever-so slightly recently
The State of the Big-Picture Market Models
Finally, let's review our favorite big-picture market models, which are designed to tell us which team is in control of the prevailing major trend.
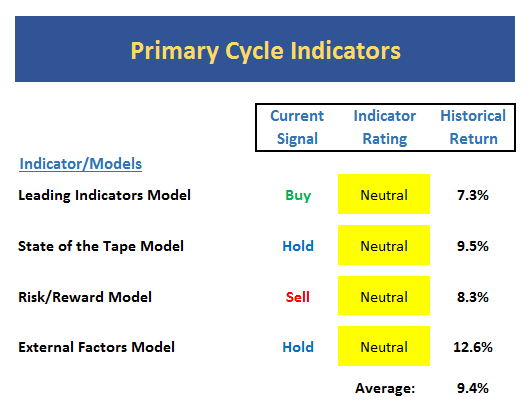
View My Favorite Market Models Online
Executive Summary:
- The Leading Indicators model recently flashed a fresh buy signal. But then the model reading slipped back into the neutral zone last week.
- The Tape is basically high-neutral at this time. This tells us it is okay to be long, but not to get nutty.
- The Risk/Reward model continues to be plagued by monetary conditions and overvaluation.
- The External Factors model has improved within the neutral zone of late and is heading in the right direction.
The Takeaway...
The key takeaways from the model review this week are (1) the trend is up, but (2) so far at least, we haven't seen any of the traditional "thrust" signals that tend to accompany the beginning of a new leg higher. This causes me to recall the famous old Wendy's commercial, with the old woman saying, "Where's the beef?" Next, it is worth noting that (3) stocks are still in sync with the cycle projections at this point in the year and the cycles point higher for the next month. (4) Earnings and, in turn, valuations, have improved (albeit ever-so slightly) which is a fundamental positive and likely worth a few percentage points on the S&P. However, (5) the monetary and overall levels of the valuation models tell us that this is no time to become complacent. In sum, it is getting late in the game and we must recognize that although the bulls are large and in charge, risk factors are elevated.
Thought For The Day:
Remember to answer the door and say hello when opportunity knocks...
Current Market Drivers
We strive to identify the driving forces behind the market action on a daily basis. The thinking is that if we can both identify and understand why stocks are doing what they are doing on a short-term basis; we are not likely to be surprised/blind-sided by a big move. Listed below are what we believe to be the driving forces of the current market (Listed in order of importance).
1. The State of Trump Administration Policies
2. The State of the U.S. Economy
3. The State of Earning Growth
Wishing you green screens and all the best for a great day,

David D. Moenning
Chief Investment Officer
Sowell Management Services
Disclosure: At the time of publication, Mr. Moenning and/or Sowell Management Services held long positions in the following securities mentioned: none. Note that positions may change at any time.
Looking for a "Modern" approach to Asset Allocation and Portfolio Design?
Looking for More on the State of the Markets?
Disclosures
The opinions and forecasts expressed herein are those of Mr. David Moenning and may not actually come to pass. Mr. Moenning's opinions and viewpoints regarding the future of the markets should not be construed as recommendations. The analysis and information in this report is for informational purposes only. No part of the material presented in this report is intended as an investment recommendation or investment advice. Neither the information nor any opinion expressed constitutes a solicitation to purchase or sell securities or any investment program.
Any investment decisions must in all cases be made by the reader or by his or her investment adviser. Do NOT ever purchase any security without doing sufficient research. There is no guarantee that the investment objectives outlined will actually come to pass. All opinions expressed herein are subject to change without notice. Neither the editor, employees, nor any of their affiliates shall have any liability for any loss sustained by anyone who has relied on the information provided.
The analysis provided is based on both technical and fundamental research and is provided "as is" without warranty of any kind, either expressed or implied. Although the information contained is derived from sources which are believed to be reliable, they cannot be guaranteed.
David D. Moenning is an investment adviser representative of Sowell Management Services, a registered investment advisor. For a complete description of investment risks, fees and services, review the firm brochure (ADV Part 2) which is available by contacting Sowell. Sowell is not registered as a broker-dealer.
Employees and affiliates of Sowell may at times have positions in the securities referred to and may make purchases or sales of these securities while publications are in circulation. Positions may change at any time.
Investments in equities carry an inherent element of risk including the potential for significant loss of principal. Past performance is not an indication of future results.
Advisory services are offered through Sowell Management Services.
Recent free content from FrontRange Trading Co.
-
 Is The Bull Argument Too Easy These Days?
— 8/31/20
Is The Bull Argument Too Easy These Days?
— 8/31/20
-
What Do The Cycles Say About 2020?
— 1/21/20
-
Modeling 2020 Expectations (Just For Fun)
— 1/13/20
-
Tips From Real-World Wendy Rhoades
— 5/06/19
-
The Best Recession Ever!
— 4/29/19
-
{[comment.author.username]} {[comment.author.username]} — Marketfy Staff — Maven — Member


- 1 Campus Martius, Suite #200Detroit, MI 48226
- +1 877 440 9464