

Indicators Not In Their Happy Places
Good Monday morning and welcome back. Hopefully, your computer doesn't make you WannaCry this morning as the global cyber attack has apparently infected more than 200,000 computers so far. Oil, North Korea, and European politics are also in focus this morning. A barrel of West Texas Intermediate crude was trading up more than a dollar in early trade Monday as the Saudi's and Russia publicly announced they favor extending production cuts into the first quarter of 2018. In the latest round of provocations, North Korea launched a new ballistic missile that can purportedly carry a nuclear warhead. And in Europe, Emmanuel Macron was sworn in as France's next President and Angela Merkel's party received a boost over the weekend, creating hope for stability in the region. On the markets front, stability seems to be the key word to start the day as there are no new political surprises out of Washington.
Since it's Monday, let's move on to an objective review the key market models and indicators. The primary goal of this exercise is to remove any subjective notions about the markets and ensure that we stay in line with what "is" happening in the market. So, let's get started...
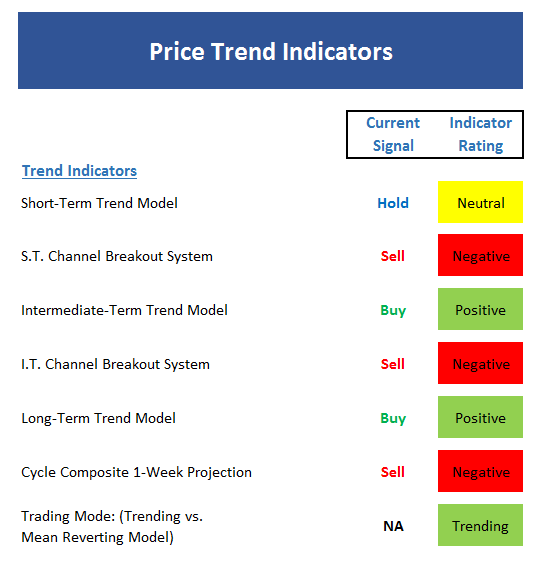
The State of the Trend
We start each week with a look at the "state of the trend." These indicators are designed to give us a feel for the overall health of the current short- and intermediate-term trend models.
Executive Summary:
- While the overall trend of the stock market is up, the short-term Trend Model has sagged a bit due to the sideways action seen over the last three weeks.
- The short-term Channel Breakout System remains on a sell signal at this time. A close above 2404 would trigger a new buy signal.
- The intermediate-term trend of the market remains positive.
- The intermediate-term Channel Breakout System is mirroring the short-term at this time.
- The long-term Trend Model is solidly positive
- The Cycle Composite points lower this week but is close to turning positive for what could turn out to be a summer rally.
- The Trading Mode models now agree that the market is in a "trending" mode.
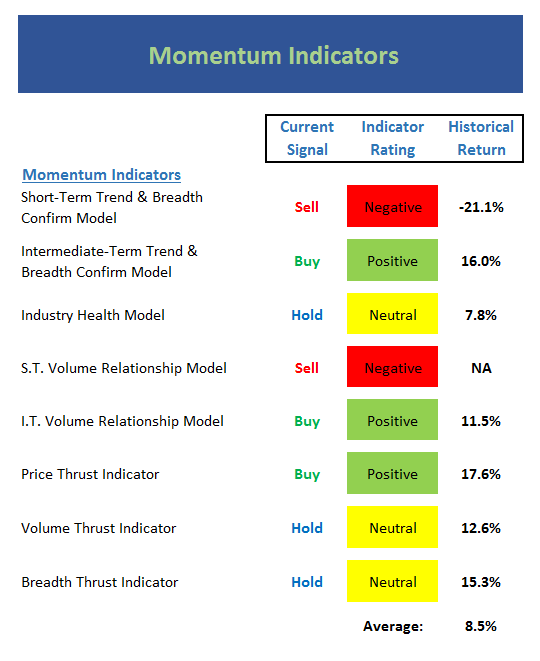
The State of Internal Momentum
Next up are the momentum indicators, which are designed to tell us whether there is any "oomph" behind the current trend...
Executive Summary:
- The short-term Trend and Breadth Confirm Model is being whipped back and forth by the extremely tight trading range - and is currently negative.
- Our intermediate-term Trend and Breadth Confirm Model remains positive.
- The Industry Health Model remains stuck in neutral - a sign that market leadership is narrow.
- The short-term Volume Relationship has turned negative again. This in spite of the market indices being near all-time highs. This is something to watch.
- The intermediate-term Volume Relationship model itself remains positive. But the up volume smoothing is in a clear downtrend and down volume is trending higher.
- The Price Thrust Indicator is still in the green zone - but not by much.
- The Volume Thrust Indicator is going nowhere fast.
- The Breadth Thrust Indicator is also neutral.
- The combination of the Thrust Indicators tells me that the bulls have no real momentum at this time.
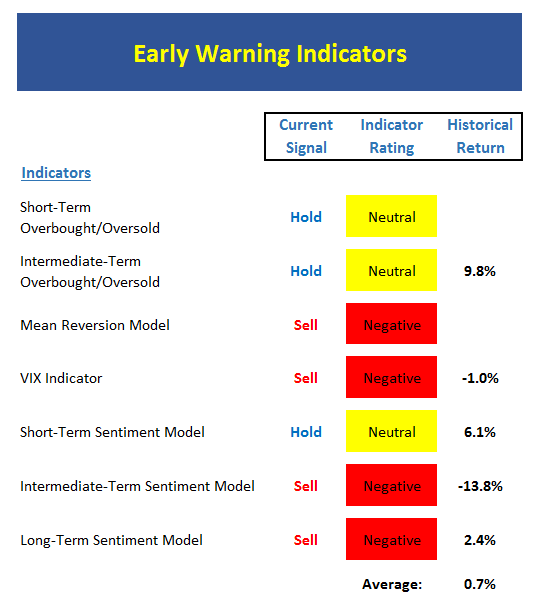
The State of the "Trade"
We also focus each week on the "early warning" board, which is designed to indicate when traders may start to "go the other way" -- for a trade.
Executive Summary:
- From a near-term perspective, the market has worked off the overbought condition and is now neutral.
- From an intermediate-term view, stocks remain neutral. Thus, neither team has a clear advantage here.
- The Mean Reversion Model remains on a Sell Signal.
- The VIX Indicator gave a sell signal more than 10 days ago, as such the signal will soon "drop off"
- From a short-term perspective, market sentiment remains neutral.
- No change, the intermediate-term Sentiment Model is still negative.
- Longer-term Sentiment readings are also still negative.
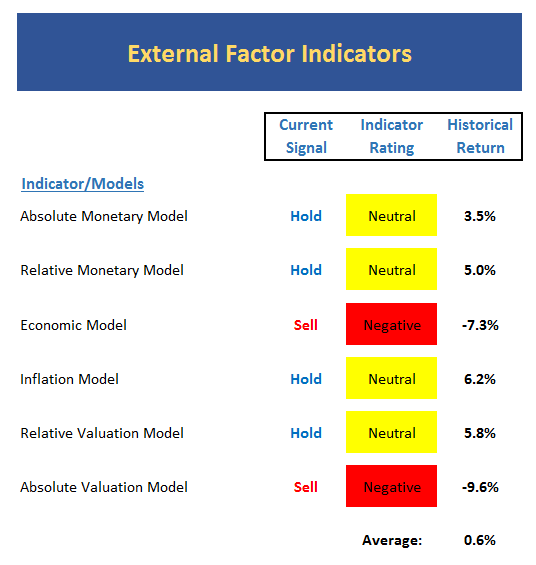
The State of the Macro Picture
Now let's move on to the market's "external factors" - the indicators designed to tell us the state of the big-picture market drivers including monetary conditions, the economy, inflation, and valuations.
Executive Summary:
- The song remains the same as the absolute Monetary model is in the lower reaches of neutral.
- On a relative basis, our Monetary Models continue to move up in the neutral zone.
- Our Economic Model (designed to call the stock market) is improving, but is still (a) negative and (b) out of sync.
- The Inflation Model continues to move lower and in the neutral zone.
- Our Relative Valuation Model is near the lowest readings since 2009 but remains in the neutral zone.
- The Absolute Valuation Model is still a screaming sell.
The State of the Big-Picture Market Models
Finally, let's review our favorite big-picture market models, which are designed to tell us which team is in control of the prevailing major trend.
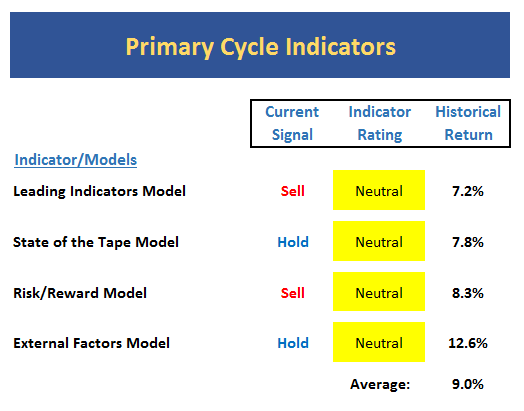
Executive Summary:
- The Leading Indicators model, which did a fine job signaling the start and end of the last bear phase, issued a sell signal last month and remains in the neutral zone. However, it is worth noting that the reading of the model is improving.
- The State of the Tape model remains neutral at this time due to narrowing leadership
- The Risk/Reward model remains on a sell signal but has moved back up to high neutral reading.
- There is no change to the External Factors model this week as the reading remains a smidge into the neutral zone.
The Takeaway...
Although the S&P continues to flirt with new highs and the trend of the NASDAQ is clearly up, my favorite, longer-term, big-picture models are not in their happy places at the present time. As such, I'm going to call this a potential key divergence. And while this type of condition can stay in place for a long period of time, it is worth noting that such conditions are also associated with aging bull markets. So, as I've been saying for some time now, I see risk factors as elevated.
Thought For The Day:
When things aren't adding up in your life, perhaps it's time to start subtracting...
Current Market Drivers
We strive to identify the driving forces behind the market action on a daily basis. The thinking is that if we can both identify and understand why stocks are doing what they are doing on a short-term basis; we are not likely to be surprised/blind-sided by a big move. Listed below are what we believe to be the driving forces of the current market (Listed in order of importance).
1. The State of Trump Administration Policies
2. The State of the U.S. Economy
3. The State of Earning Season
4. The State of World Politics
Wishing you green screens and all the best for a great day,

David D. Moenning
Chief Investment Officer
Sowell Management Services
Disclosure: At the time of publication, Mr. Moenning and/or Sowell Management Services held long positions in the following securities mentioned: none. Note that positions may change at any time.
Looking for a "Modern" approach to Asset Allocation and Portfolio Design?
Looking for More on the State of the Markets?
Disclosures
The opinions and forecasts expressed herein are those of Mr. David Moenning and may not actually come to pass. Mr. Moenning's opinions and viewpoints regarding the future of the markets should not be construed as recommendations. The analysis and information in this report is for informational purposes only. No part of the material presented in this report is intended as an investment recommendation or investment advice. Neither the information nor any opinion expressed constitutes a solicitation to purchase or sell securities or any investment program.
Any investment decisions must in all cases be made by the reader or by his or her investment adviser. Do NOT ever purchase any security without doing sufficient research. There is no guarantee that the investment objectives outlined will actually come to pass. All opinions expressed herein are subject to change without notice. Neither the editor, employees, nor any of their affiliates shall have any liability for any loss sustained by anyone who has relied on the information provided.
The analysis provided is based on both technical and fundamental research and is provided "as is" without warranty of any kind, either expressed or implied. Although the information contained is derived from sources which are believed to be reliable, they cannot be guaranteed.
David D. Moenning is an investment adviser representative of Sowell Management Services, a registered investment advisor. For a complete description of investment risks, fees and services, review the firm brochure (ADV Part 2) which is available by contacting Sowell. Sowell is not registered as a broker-dealer.
Employees and affiliates of Sowell may at times have positions in the securities referred to and may make purchases or sales of these securities while publications are in circulation. Positions may change at any time.
Investments in equities carry an inherent element of risk including the potential for significant loss of principal. Past performance is not an indication of future results.
Advisory services are offered through Sowell Management Services.
Recent free content from FrontRange Trading Co.
-
 Is The Bull Argument Too Easy These Days?
— 8/31/20
Is The Bull Argument Too Easy These Days?
— 8/31/20
-
What Do The Cycles Say About 2020?
— 1/21/20
-
Modeling 2020 Expectations (Just For Fun)
— 1/13/20
-
Tips From Real-World Wendy Rhoades
— 5/06/19
-
The Best Recession Ever!
— 4/29/19
-
{[comment.author.username]} {[comment.author.username]} — Marketfy Staff — Maven — Member


- 1 Campus Martius, Suite #200Detroit, MI 48226
- +1 877 440 9464