

Leadership Is Clearly Narrowing
Good Monday morning and welcome back. The election in France, Warren Buffett wisdom, and oil are in focus this morning. On the election front, there was no big populist surprise in France on Sunday after Emmanuel Macron ran away with the Presidential election. As for Berkshire Hathaway's big meeting over the weekend, Warren Buffett and Charlie Munger entertained the crowd of more than 40,000 by espousing investing wisdom as well a mea culpa or two on investing in technology. And finally, Saudi Arabia and Russia appear to be working together on extending production cuts in an effort to bolster the sagging price of crude. On Wall Street, stock futures are pointing to a sloppy open. Today, the bulls will be looking to extend the recent rally and establish a new upleg while the bears are hoping to push the S&P 500 back into its two-plus month trading range.
Since it's Monday, let's move on to an objective review the key market models and indicators. The primary goal of this exercise is to remove any preconceived, subjective notions about the markets and ensure that we stay in line with what "is" really happening in the market. So, let's get started...
The State of the Trend
We start each week with a look at the "state of the trend." These indicators are designed to give us a feel for the overall health of the current short- and intermediate-term trend models.
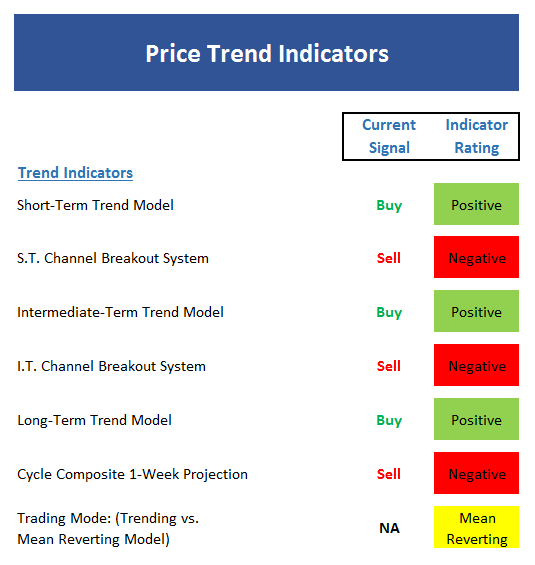
Executive Summary:
- The short-term Trend Model is positive at this time as price is above its upwardly sloping smoothing
- The short-term Channel Breakout System is technically negative, but within a point of flipping to positive. So, any advance from Friday's close would produce a "breakout" buy signal.
- The intermediate-term Trend Model remains solidly positive
- The intermediate-term Channel Breakout System signal is the same as the short-term system at this point. See above.
- The long-term Trend Model is positive
- The Cycle Composite points lower for the next couple weeks
- The Trading Mode models remain in mean-reverting mode. However, with the NASDAQ trending higher and the S&P close to breaking out, I would expect these indicators to confirm in the near-term
The State of Internal Momentum
Next up are the momentum indicators, which are designed to tell us whether there is any "oomph" behind the current trend...
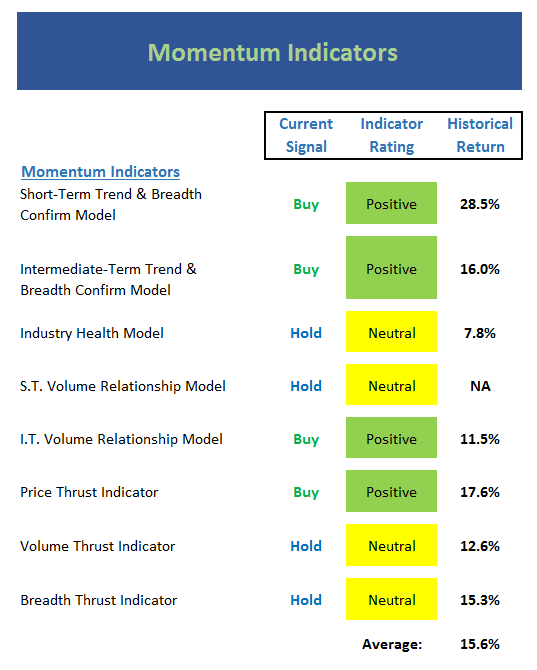
Executive Summary:
- Our short-term Trend and Breadth Confirm Model moved up into positive territory - but only by the skinniest of margins
- The intermediate-term Trend and Breadth Confirm Model has remained positive for several weeks now - a positive sign
- The Industry Health Model remains stuck in neutral - an indication of narrow market leadership, which is typical of late-stage bulls
- The short-term Volume Relationship has improved and is close to turning positive. However, I would expect to see stronger readings here with the market at all-time highs.
- The intermediate-term Volume Relationship is healthy
- The Price Thrust Indicator is currently positive, but again, not at the level you'd like to see at new highs
- The Volume Thrust Indicator slipped to neutral last week but could easily break back into green with some upside movement in the indices
- The Breadth Thrust Indicator also slipped into the neutral zone. Again, this is not what you would expect to see with record close
The State of the "Trade"
We also focus each week on the "early warning" board, which is designed to indicate when traders may start to "go the other way" -- for a trade.
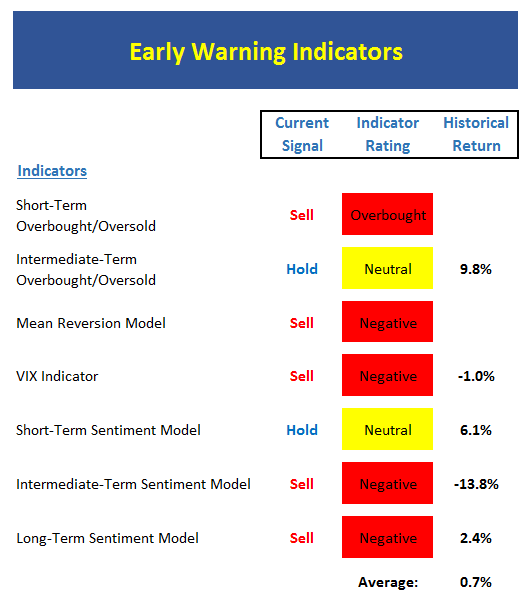
Executive Summary:
- From a near-term perspective, stocks are overbought. And my favorite stochastic is on the verge of signaling a "positive overbought" reading (a market that gets overbought and stays overbought tends to be strong)
- From an intermediate-term view, stocks are neutral. This tells us that the bulls have some room to run if they can find a reason.
- The Mean Reversion Model remains on a sell signal.
- Both of my VIX Indicators have flashed sell signals recently.
- From a short-term perspective, market sentiment is remains neutral
- The intermediate-term Sentiment Model remains negative
- Longer-term Sentiment readings continue to be overly optimistic - a negative
The State of the Macro Picture
Now let's move on to the market's "external factors" - the indicators designed to tell us the state of the big-picture market drivers including monetary conditions, the economy, inflation, and valuations.
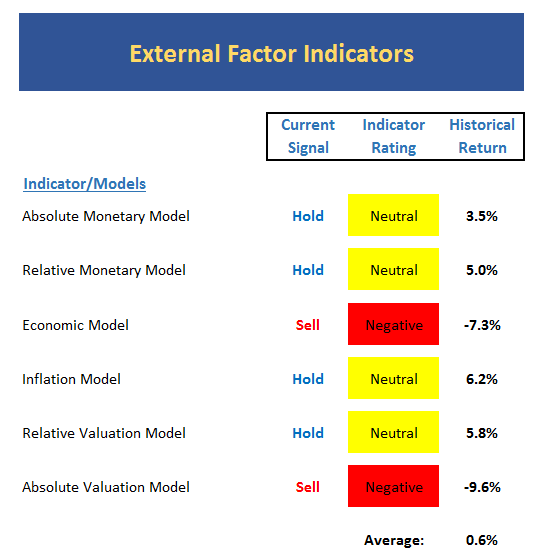
Executive Summary:
- Absolute Monetary conditions are holding steady in the lower reaches of the neutral zone
- On a relative basis, our Monetary Model continues to improve within the neutral zone
- Our Economic Model (designed to call the stock market) remains out of sync, but is improving
- The Inflation Model continues to pull back within the neutral zone. As I've mentioned recently, this tells me the recent inflationary pressures are receding.
- Our Relative Valuation Model is now solidly in neutral zone
- The Absolute Valuation Model remains very negative
The State of the Big-Picture Market Models
Finally, let's review our favorite big-picture market models, which are designed to tell us which team is in control of the prevailing major trend.
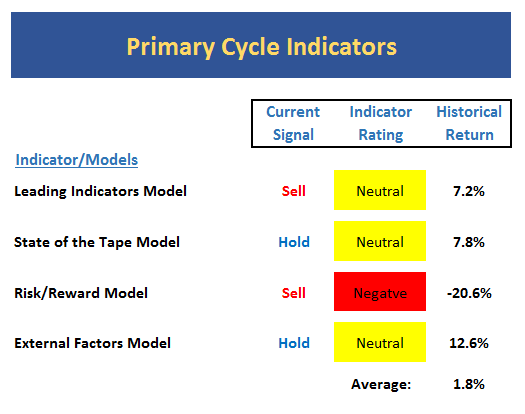
Executive Summary:
- The Leading Indicators model, which did a fine job during the last bear phase, issued a sell signal last month and remains in the neutral zone
- The State of the Tape model remains neutral at this time due to narrowing leadership
- The Risk/Reward model slipped back into the red zone last week and continues to be plagued by weak monetary conditions and extreme sentiment readings
- The External Factors model improved last week and moved into a mode where stocks perform above the mean. However, the overall reading remains neutral.
The Takeaway...
The good news is the NASDAQ continues to march to new highs and the S&P 500 managed to also close at a record high on Friday. The bad news is that market leadership has continued to narrow, a condition that typically occurs during the late stages of a bull market. Couple this with (a) the weak readings seen in my big-picture models and (b) the fact that our cycle work projects an ongoing rally into August and then a meaningful decline, and the argument can be made that we may be seeing the beginning of "blowoff" stage. Thus, it is important to recognize that this is NOT a low risk environment.
Thought For The Day:
A word of encouragement after failure is worth more than an hour of praise after success.
Current Market Drivers
We strive to identify the driving forces behind the market action on a daily basis. The thinking is that if we can both identify and understand why stocks are doing what they are doing on a short-term basis; we are not likely to be surprised/blind-sided by a big move. Listed below are what we believe to be the driving forces of the current market (Listed in order of importance).
1. The State of Geopolitical Issues
2. The State of Earning Season
3. The State of Trump Administration Policies
4. The State of the U.S. Economy
Wishing you green screens and all the best for a great day,

David D. Moenning
Chief Investment Officer
Sowell Management Services
Looking for a "Modern" approach to Asset Allocation and Portfolio Design?
Looking for More on the State of the Markets?
Investment Pros: Looking to modernize your asset allocations, add risk management to client portfolios, or outsource portfolio Management? Contact Eric@SowellManagement.com
Disclosures
The opinions and forecasts expressed herein are those of Mr. David Moenning and may not actually come to pass. Mr. Moenning's opinions and viewpoints regarding the future of the markets should not be construed as recommendations. The analysis and information in this report is for informational purposes only. No part of the material presented in this report is intended as an investment recommendation or investment advice. Neither the information nor any opinion expressed constitutes a solicitation to purchase or sell securities or any investment program.
Any investment decisions must in all cases be made by the reader or by his or her investment adviser. Do NOT ever purchase any security without doing sufficient research. There is no guarantee that the investment objectives outlined will actually come to pass. All opinions expressed herein are subject to change without notice. Neither the editor, employees, nor any of their affiliates shall have any liability for any loss sustained by anyone who has relied on the information provided.
The analysis provided is based on both technical and fundamental research and is provided "as is" without warranty of any kind, either expressed or implied. Although the information contained is derived from sources which are believed to be reliable, they cannot be guaranteed.
David D. Moenning is an investment adviser representative of Sowell Management Services, a registered investment advisor. For a complete description of investment risks, fees and services, review the firm brochure (ADV Part 2) which is available by contacting Sowell. Sowell is not registered as a broker-dealer.
Employees and affiliates of Sowell may at times have positions in the securities referred to and may make purchases or sales of these securities while publications are in circulation. Positions may change at any time.
Investments in equities carry an inherent element of risk including the potential for significant loss of principal. Past performance is not an indication of future results.
Advisory services are offered through Sowell Management Services.
Recent free content from FrontRange Trading Co.
-
 Is The Bull Argument Too Easy These Days?
— 8/31/20
Is The Bull Argument Too Easy These Days?
— 8/31/20
-
What Do The Cycles Say About 2020?
— 1/21/20
-
Modeling 2020 Expectations (Just For Fun)
— 1/13/20
-
Tips From Real-World Wendy Rhoades
— 5/06/19
-
The Best Recession Ever!
— 4/29/19
-
{[comment.author.username]} {[comment.author.username]} — Marketfy Staff — Maven — Member


- 1 Campus Martius, Suite #200Detroit, MI 48226
- +1 877 440 9464