

One of These Doesn't Look Like the Others
As I have written a time or two over the last few years, I'm of the opinion that the much of near-term machinations in the stock market are now mostly noise. Humans making judgement calls about what they see in a company or the economy are no longer the driving factor of intraday activity. No, nowadays its the machines that execute the vast majority of transactions at the Mahwah, NJ data center, not traders at the corner of Broad and Wall.
Yes, I still do have 1-minute charts up on my screen. But these charts are not there to identify key levels in indices but instead to help me identify (a) when news hits and (b) how important the news item appears to be.
I bring this up not as a critique or a judgement, rather as a preface to the point that I now prefer to look at the short-term action in the market from a bigger-picture perspective. There was a time that when Line A crossed Line B on a chart, I would proceed to automatically, and without a hint of emotion, make a move in a portfolio strategy (anybody remember when a 30-day moving average with 3% bands on either side was considered a sophisticated trading scheme?). However, with short-term trends now driven by algorithms executing instructions on a millisecond basis, I choose to hunt for a "message" when looking at charts - not exact trigger points.
Sure, there are still key lines in the sand that, when broken, will undoubtedly trigger the algos to react. Therefore, it can certainly be beneficial to know where the key levels are on the charts. I.E. The levels that "everyone" is watching.
But today, I think the key to the game is to ignore as much of the short-term action as humanly possible and to focus on the important market trends and cycles. And in effort to try and ascertain when an important move is about to begin or end, I look at (a) a myriad of market indicators and models (a great many of which I share each Monday morning) and (b) what the market is "actually doing" at any given time.
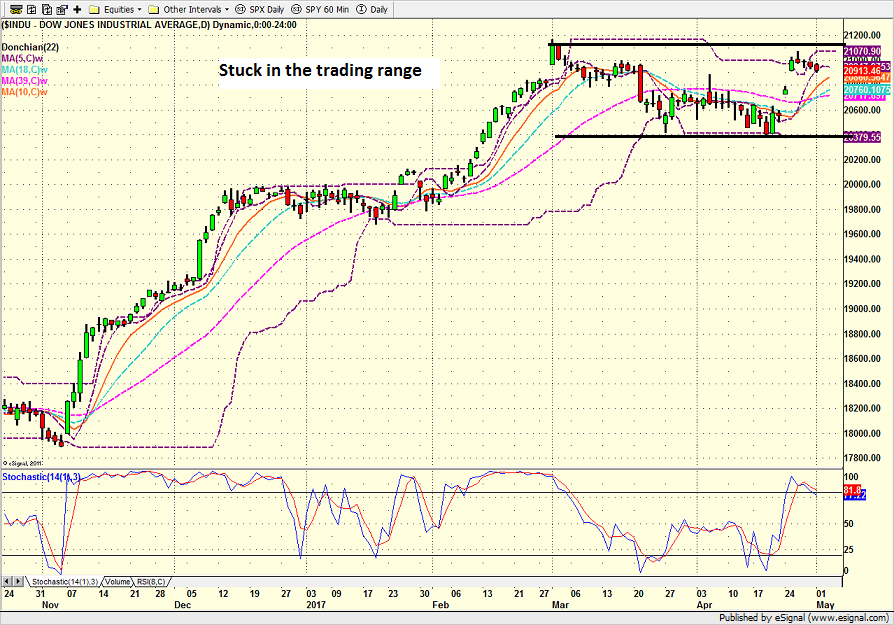
For example, if you glance at the daily charts of the Dow Jones Industrial Average or the S&P 500, you will likely conclude that stocks are stuck in a sideways trading range. Take a peek...
Dow Jones Industrial Average - Daily 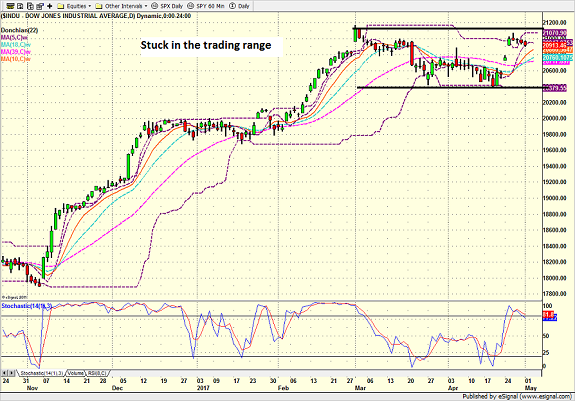
View Larger Image
Even without the lines I drew in, the range on the venerable Dow is pretty easy to see, right?
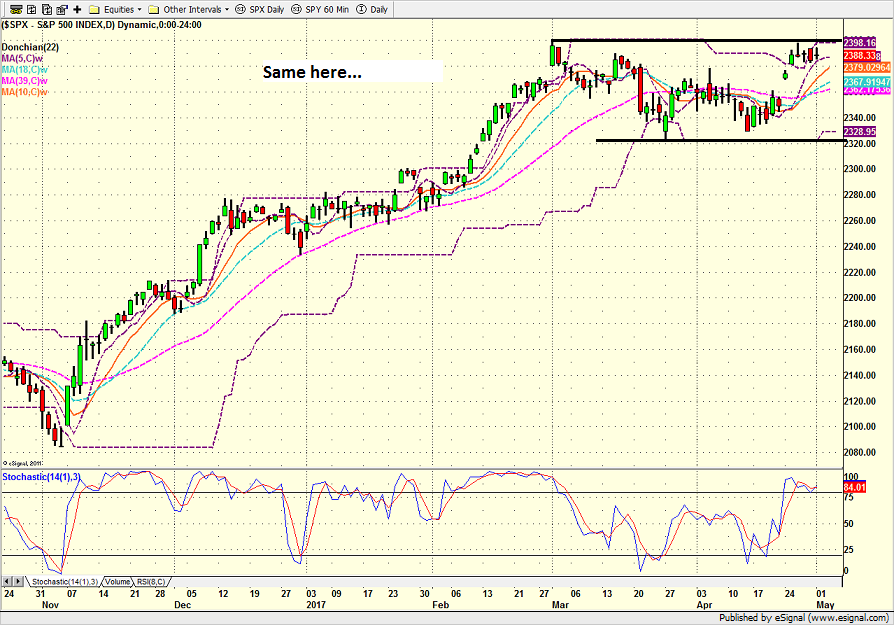
And the same thing can be said when looking at the chart of the S&P 500.
S&P 500 - Daily 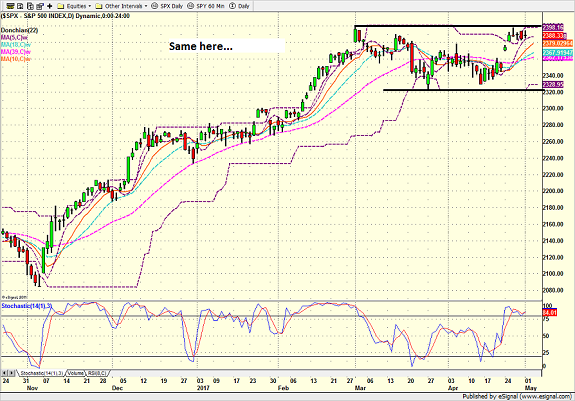
View Larger Image
But before I assume that I've got the situation nailed, I like to look at a few more charts to make sure the indices are all singing the same song.
SPDR S&P Midcap 400 - Daily 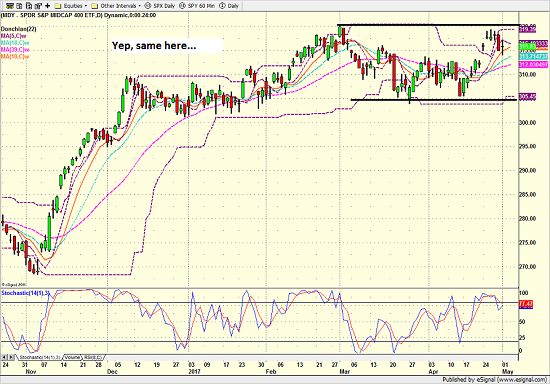
View Larger Image
While not terribly surprising, the Midcaps are tracing out a similar pattern on the charts.
And while the chart isn't identical, the chart of the Russell 2000 smallcaps have a similar look and feel.
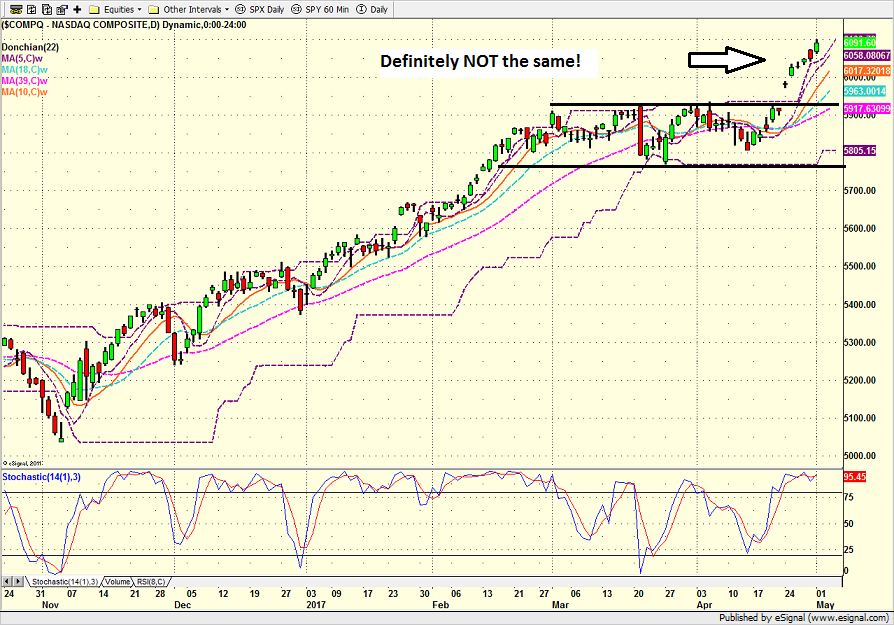
However, when the chart of the NASDAQ Composite, the story changes rather dramatically.
NASDAQ Composite - Daily 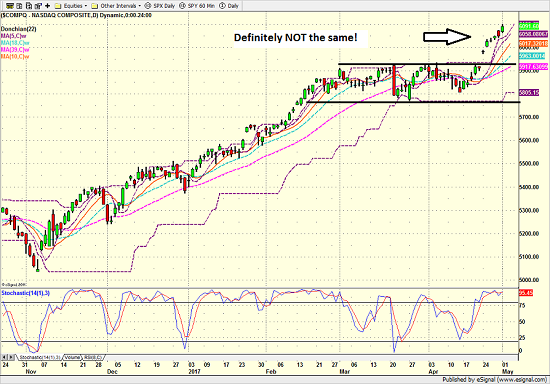
View Larger Image
See what I mean? While the chart of the NASDAQ was also stuck in a range for more than three months, the tech-heavy index clearly broke out on 4/24 and now appears to be embarking on a new leg higher.
The question, of course, is which "message" should you follow? The stuck-in-neutral, nothing-to-see-here message from the SPX, the Dow, the Midcaps, and Smallcaps? Or, the-train-is-leaving-the-station message from the NASDAQ?
While nothing works every time in this business, I have long believed in the premise that leaders lead and the rest fall in line, eventually. As such, my guess is the NASDAQ could very well be the "tell" as to what may happen next in Ms. Market's game.
Or... An alternative "message" here is we are seeing a case of the FANG's rockin' higher on strong earnings as the leadership in the overall market narrows. Time will tell.
Publishing Note: I have an early an commitment tomorrow morning and will not publish a Daily State report.
Thought For The Day:
Good, better, best. Never let it rest. Until your good is better and your better is best. -Tim Duncan
Current Market Drivers
We strive to identify the driving forces behind the market action on a daily basis. The thinking is that if we can both identify and understand why stocks are doing what they are doing on a short-term basis; we are not likely to be surprised/blind-sided by a big move. Listed below are what we believe to be the driving forces of the current market (Listed in order of importance).
1. The State of Trump Administration Policies
2. The State of the U.S. Economy
3. The State of Earning Season
4. The State of World Politics
Wishing you green screens and all the best for a great day,

David D. Moenning
Chief Investment Officer
Sowell Management Services
Disclosure: At the time of publication, Mr. Moenning and/or Sowell Management Services held long positions in the following securities mentioned: none. Note that positions may change at any time.
Looking for a "Modern" approach to Asset Allocation and Portfolio Design?
Looking for More on the State of the Markets?
Disclosures
The opinions and forecasts expressed herein are those of Mr. David Moenning and may not actually come to pass. Mr. Moenning's opinions and viewpoints regarding the future of the markets should not be construed as recommendations. The analysis and information in this report is for informational purposes only. No part of the material presented in this report is intended as an investment recommendation or investment advice. Neither the information nor any opinion expressed constitutes a solicitation to purchase or sell securities or any investment program.
Any investment decisions must in all cases be made by the reader or by his or her investment adviser. Do NOT ever purchase any security without doing sufficient research. There is no guarantee that the investment objectives outlined will actually come to pass. All opinions expressed herein are subject to change without notice. Neither the editor, employees, nor any of their affiliates shall have any liability for any loss sustained by anyone who has relied on the information provided.
The analysis provided is based on both technical and fundamental research and is provided "as is" without warranty of any kind, either expressed or implied. Although the information contained is derived from sources which are believed to be reliable, they cannot be guaranteed.
David D. Moenning is an investment adviser representative of Sowell Management Services, a registered investment advisor. For a complete description of investment risks, fees and services, review the firm brochure (ADV Part 2) which is available by contacting Sowell. Sowell is not registered as a broker-dealer.
Employees and affiliates of Sowell may at times have positions in the securities referred to and may make purchases or sales of these securities while publications are in circulation. Positions may change at any time.
Investments in equities carry an inherent element of risk including the potential for significant loss of principal. Past performance is not an indication of future results.
Advisory services are offered through Sowell Management Services.
Recent free content from FrontRange Trading Co.
-
 Is The Bull Argument Too Easy These Days?
— 8/31/20
Is The Bull Argument Too Easy These Days?
— 8/31/20
-
What Do The Cycles Say About 2020?
— 1/21/20
-
Modeling 2020 Expectations (Just For Fun)
— 1/13/20
-
Tips From Real-World Wendy Rhoades
— 5/06/19
-
The Best Recession Ever!
— 4/29/19
-
{[comment.author.username]} {[comment.author.username]} — Marketfy Staff — Maven — Member


- 1 Campus Martius, Suite #200Detroit, MI 48226
- +1 877 440 9464