

The Message From the Indicators Is...
Good Monday morning and welcome back. While spring break season is underway and you may be more focused on getting to the beach or working on your short game, let's start the week with a review my key market models and indicators. Remember, the primary goal of this exercise (something I actually do on a daily basis) is to remove any preconceived, subjective notions about the markets and ensure that I stay in line what "is" really happening in the market.
The State of the Trend
We start each week with a look at the "state of the trend" from our objective indicator panel. These indicators are designed to give us a feel for the overall health of the current short- and intermediate-term trend models.
Executive Summary:
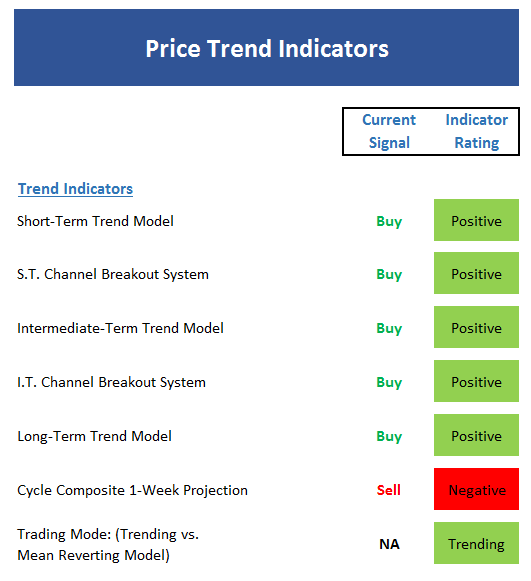
- The short-term Trend Model is technically positive - but only by a smidge
- A break below 2354 by mid-week would turn the Short-Term Channel Breakout system negative
- The Intermediate-Term Trend model is still very positive
- The intermediate-term Channel Breakout system sell point currently stands at 2335 but is currently trending upward and will be at 2350 by late this week
- The Long-Term Trend model remains positive
- The Cycle Composite is negative for the next week and projects a see-saw decline into mid-April
- The Trading Mode models still say this is a trending market
The State of Internal Momentum
Now we turn to the momentum indicators...
Executive Summary:
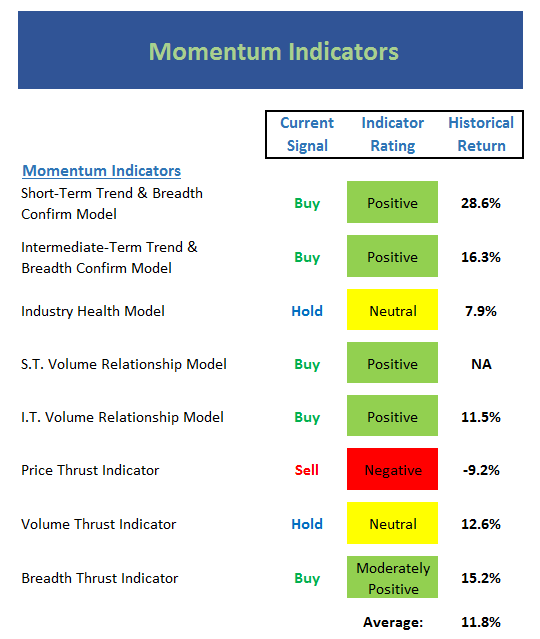
- The short-term Trend & Breadth models are technically positive, but barely so. Also, I will note that since 2011, a positive reading has actually produced a return of -2.32% annualized as this remains one of the traditionally solid indicators that has been negatively impacted by the advancement of high speed trading and the proliferation of ETFs.
- The intermediate-term Trend & Breadth model is still solidly positive - a good sign
- No change in the Industry Health Model. This indicator should be viewed as moderately positive from a big-picture standpoint
- The short-term Volume Relationship indicators is back in positive mode - but only modestly so
- From a long-term perspective, the demand/supply relationship of volume is in good shape
- The Price-Thrust indicator is on the edge of neutral - so this is not as negative as it may appear
- The Volume Thrust indicator is moving from negative to neutral is a positive development - note that the historical return is pretty strong for a neutral reading
- While the Breadth Thrust indicator is technically neutral, the market's historical return when in mode is very strong - so we will color it green
The State of the "Trade"
Next up is the "early warning" board, which is designed to indicate when traders may start to "go the other way" -- for a trade.
Executive Summary:
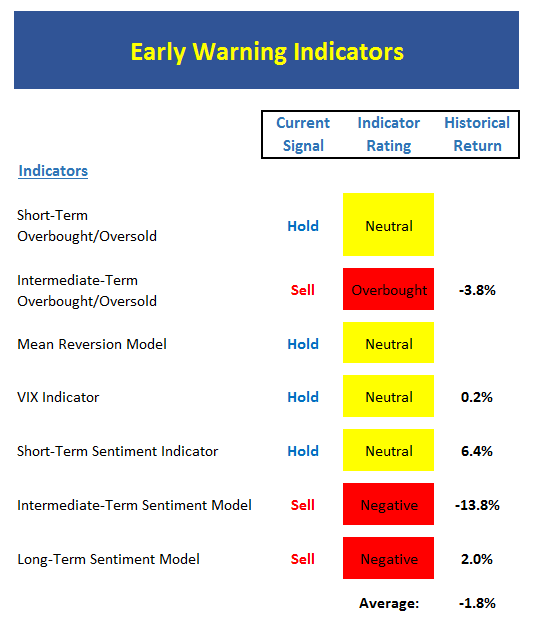
- After being overbought for much of 2017, the indicators are now neutral. We should note that market unable to get to an oversold reading - a sign of strength
- The intermediate-term Overbought/Sold indicator flirted with moving to neutral recently, but is back in overbought territory
- The Mean Reversion model has been unable to flash a signal lately - likely due to the lack of volatility seen in market
- The recent buy signal in the intermediate-term VIX indicators has "worn off" and volatility continues to remain in a very tight range. Recall that such extended periods of low vol are rare
- Extreme short-term sentiment reading has been worked off - now neutral
- Sentiment remains overly optimistic from a short- and long-term basis
The State of the Macro Picture
Now let's move on to the market's "external factors" - the indicators designed to tell us the state of the big-picture market drivers including monetary conditions, the economy, inflation, and valuations.
Executive Summary:
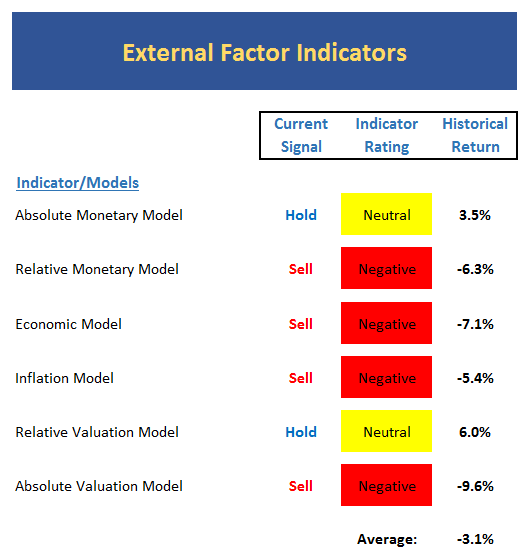
- Despite the backup in rates last week, there is really nothing new to report on monetary model front - models continue to suggest that risk is elevated
- The economic model designed to call the market continues to "get it wrong" here. However, since 1965, 79% of signals would have been profitable.
- The economic model designed to "call" the economy remains positive
- Inflation model remains in the negative zone, but only slightly so and is very close to the neutral zone. Note that both of our inflation models are now moving down - this explains the modest pullback in rates.
- Relative valuation models continue to weaken - now dead neutral
- Absolute valuation models continue to wave bright red warning flags
The State of the Big-Picture Market Models
Finally, let's review our favorite big-picture market models, which are designed to tell us which team is in control of the prevailing major trend.
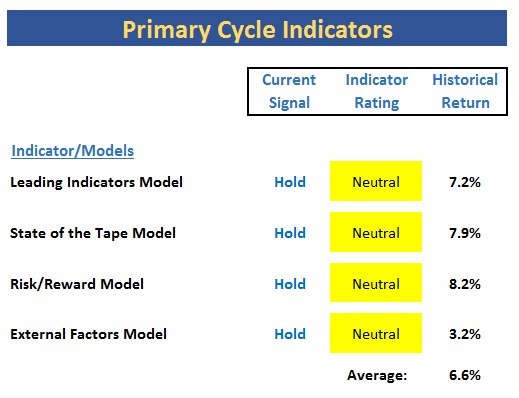
Executive Summary:
- My favorite big picture model over the last 10 years (the Leading Indicators Model) weakened last week. However, the reading remains neutral and the returns seen in this mode are only slightly below historical mean
- I've related my concerns about the message from the State of the Tape model many times already, but I will renew my nagging concern here.
- While the Risk/Reward model continues to be plagued by readings from the sentiment and monetary indicators, we shouldn't ignore the fact that this model remains low neutral
- The song remains the same in the External Factors model - it continues to move down and is very close to turning red. This is not good.
The Takeaway...
Bottom Line: The message from the indicator boards this week hasn't changed to any great degree as the bulls remain in charge and should be given the benefit of the doubt. However, too many big-picture models are flashing warning signs for comfort. As such, we must recognize that risk levels are elevated at this time. We believe that the market remains at risk for a correction in the near-term but that any pullbacks, declines, or sloppy periods would be occurring within the context of an ongoing bull market.
Thought For The Day:
Eighty percent of success is showing up. -Woody Allen
Current Market Drivers
We strive to identify the driving forces behind the market action on a daily basis. The thinking is that if we can both identify and understand why stocks are doing what they are doing on a short-term basis; we are not likely to be surprised/blind-sided by a big move. Listed below are what we believe to be the driving forces of the current market (Listed in order of importance).
1. The State of the U.S. Economy
2. The State of Trump Administration Policies
3. The State of the Fed's Next Move
4. The State of Global Central Bank Policies (Think ECB pulling back on QE)
Wishing you green screens and all the best for a great day,

David D. Moenning
Chief Investment Officer
Sowell Management Services
Looking for a "Modern" approach to Asset Allocation and Portfolio Design?
Looking for More on the State of the Markets?
Investment Pros: Looking to modernize your asset allocations, add risk management to client portfolios, or outsource portfolio Management? Contact Eric@SowellManagement.com
Disclosures
The opinions and forecasts expressed herein are those of Mr. David Moenning and may not actually come to pass. Mr. Moenning's opinions and viewpoints regarding the future of the markets should not be construed as recommendations. The analysis and information in this report is for informational purposes only. No part of the material presented in this report is intended as an investment recommendation or investment advice. Neither the information nor any opinion expressed constitutes a solicitation to purchase or sell securities or any investment program.
Any investment decisions must in all cases be made by the reader or by his or her investment adviser. Do NOT ever purchase any security without doing sufficient research. There is no guarantee that the investment objectives outlined will actually come to pass. All opinions expressed herein are subject to change without notice. Neither the editor, employees, nor any of their affiliates shall have any liability for any loss sustained by anyone who has relied on the information provided.
The analysis provided is based on both technical and fundamental research and is provided "as is" without warranty of any kind, either expressed or implied. Although the information contained is derived from sources which are believed to be reliable, they cannot be guaranteed.
David D. Moenning is an investment adviser representative of Sowell Management Services, a registered investment advisor. For a complete description of investment risks, fees and services, review the firm brochure (ADV Part 2) which is available by contacting Sowell. Sowell is not registered as a broker-dealer.
Employees and affiliates of Sowell may at times have positions in the securities referred to and may make purchases or sales of these securities while publications are in circulation. Positions may change at any time.
Investments in equities carry an inherent element of risk including the potential for significant loss of principal. Past performance is not an indication of future results.
Advisory services are offered through Sowell Management Services.
Recent free content from FrontRange Trading Co.
-
 Is The Bull Argument Too Easy These Days?
— 8/31/20
Is The Bull Argument Too Easy These Days?
— 8/31/20
-
What Do The Cycles Say About 2020?
— 1/21/20
-
Modeling 2020 Expectations (Just For Fun)
— 1/13/20
-
Tips From Real-World Wendy Rhoades
— 5/06/19
-
The Best Recession Ever!
— 4/29/19
-
{[comment.author.username]} {[comment.author.username]} — Marketfy Staff — Maven — Member


- 1 Campus Martius, Suite #200Detroit, MI 48226
- +1 877 440 9464