

Time To Sit Up And Take Notice?
Good Monday morning and welcome back! Stocks have begun the new calendar year following the traditional script with the S&P 500 and NASDAQ finishing the week at fresh all-time highs. However, the DJIA can't seem to muster the energy to push through the purportedly important 20,000 barrier and like the Midcap and Smallcap indices, remains stuck in a sideways trading range. As such, there is a bit of a divergence going on at the present time. But one thing the major indices can agree on is that stocks are overbought at the present time. And with the S&P not exactly free and clear of resistance, the debate between our two teams rages on. So, let's turn to our objective models and indicators to see if we can get a clear picture of what's really going on.
The State of the Trend
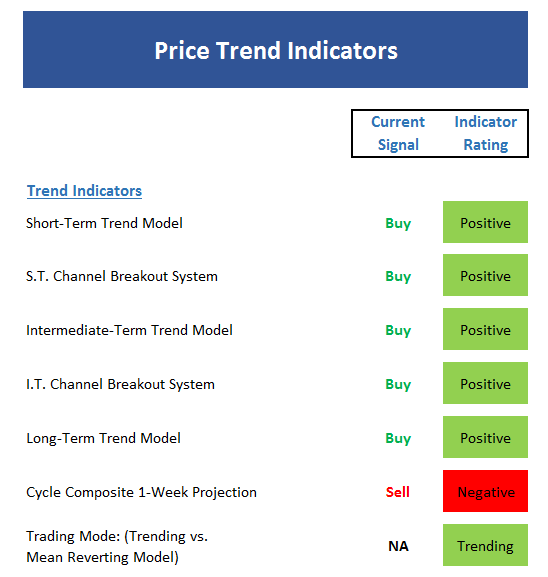
We start with a look at the "state of the trend" from our objective indicator panel. These indicators are designed to give us a feel for the overall health of the current short- and intermediate-term trend models.
Executive Summary:
- There is an awful lot of green on this board, which makes sense given the all-time closing high on the S&P 500.
- The short-term trend of the market remains positive as the S&P is above its short-term moving averages and the moving averages themselves are moving higher.
- Both the short- and intermediate-term Channel Breakout systems are on buy signals at this time.
- The longer-term trend of the market remains positive.
- Two of our three Trading Mode indicators suggest the market is trending at the present time. (One of the three flipped back to mean reverting last week).
- The only negative on the board is the Cycle Composite, which suggests a modest pullback could occur this week.
- While not technically part of this indicator set, we will continue to look for confirmation from the DJIA, Midcap and Smallcap indices in the near-term.
The State of Internal Momentum
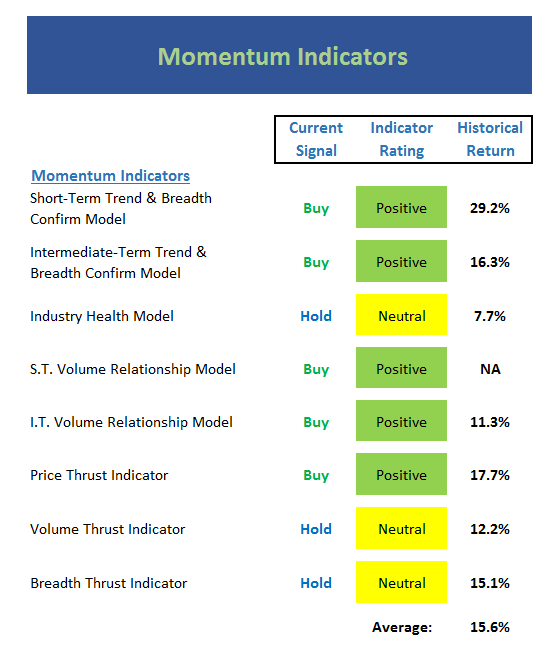
Now we turn to the momentum indicators...
Executive Summary:
- With the S&P at a new all-time high, I would prefer to see even more green on this board. This would indicate that the market was hitting on all cylinders.
- So far at least, both Trend & Breadth Confirm models are positive.
- The Industry Health model has moved back to neutral. Recall that the model had pushed up into the moderately positive zone recently.
- The fact that the Industry Health model has not confirmed the recent rally with an outright positive reading remains worrisome.
- But, the Volume Relationship models are in good shape.
- Both the Volume and Breadth Thrust indicators have fallen back into the neutral zone. This also suggests that the current move is not "robust" at the present time.
- While there is no negatives on this board, there are reasons to pay attention.
The State of the "Trade"
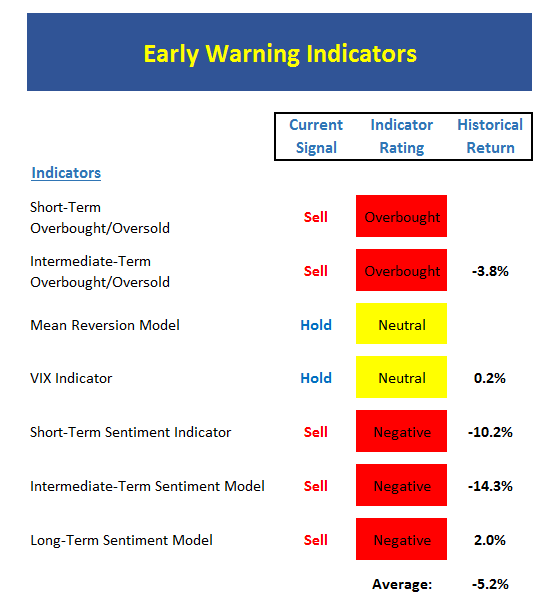
Next up is the "early warning" board, which is designed to indicate when traders may start to "go the other way" -- for a trade.
Executive Summary:
- The message from this board is fairly straightforward: Stocks are vulnerable at this stage
- Stocks are now overbought from the short-, intermediate-, and long-term perspectives
- The Mean Reversion model, which is intermediate-term oriented, remains stuck in neutral
- The VIX indicator on this board, which is also intermediate-term based, is also stuck in neutral
- Our short-term VIX indicator (not shown) is close to giving a sell signal
- Sentiment remains negative (i.e. there is too much optimism) across the board
- But... It is important to remember that the Early Warning indicators can stay negative for long periods of time during strong market rallies.
The State of the Macro Picture
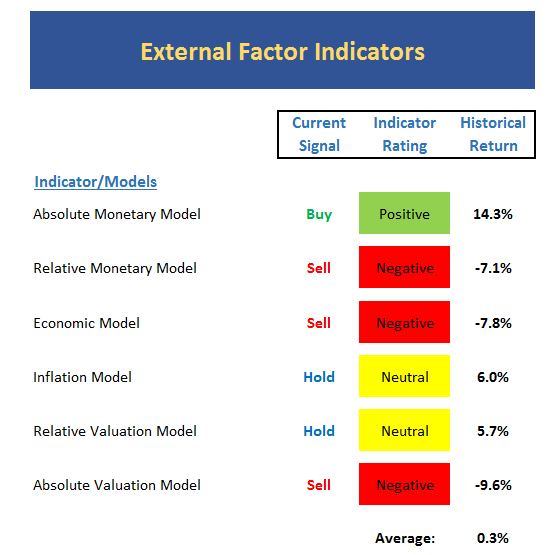
Now let's move on to the market's "external factors" - the indicators designed to tell us the state of the big-picture market drivers including monetary conditions, the economy, inflation, and valuations.
Executive Summary:
- THIS is where things start to become worrisome for the bulls.
- The "Relative" Monetary model moved to negative last week. This means the move in interest rates is starting to bite.
- The Economic model (a model using economic indicators to "call" the stock market - NOT the economy) remains negative.
- The Economic models designed to "call" the economy (not shown) remain strong, suggesting improved economic conditions
- The "Relative" Valuation model downticked to neutral last week. This is clearly due to the recent spike in yields.
- The takeaway from this board is that interest rates are starting to take their toll on the big-picture environment.
- Recall that historically, negative monetary conditions have been negative for stocks. The question is: Will things be different this time?
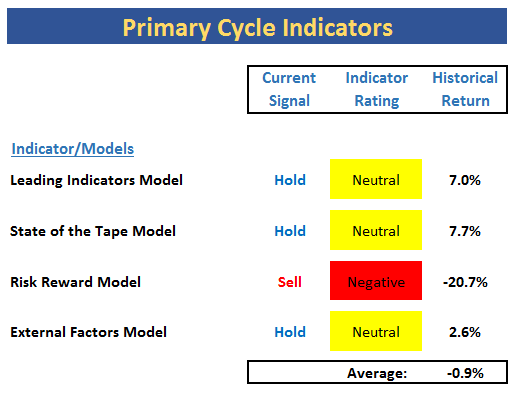
The State of the Big-Picture Market Models
Finally, let's review our favorite big-picture market models, which are designed to tell us which team is in control of the prevailing major trend.
Executive Summary:
- If the review of our major indicator boards hasn't gotten your attention yet, this board definitely should.
- In short, there is no longer any green on our Primary Cycle Indicator board.
- The Leading Indicators model has moved back to the high end of neutral.
- Ditto for the State of the Tape model.
- The Risk/Reward model, which has a heavy monetary component, has slipped to negative.
- And the External Factors model has also dipped into the neutral zone.
- The historical return average for the board is now negative.
The Takeaway...
The good news is that the NASDAQ and S&P 500 indices closed at fresh all-time highs on Friday. The bad news is the DJIA has been unable to break through the 20K barrier, the Smallcap and Midcap indices are not close to confirming, and the S&P 500 still has some resistance to deal with. Now mix in an overbought condition, extreme readings in sentiment, and deteriorating monetary conditions, and well, it would not be at all surprising to see stocks pull back in the near term. Perhaps the most concerning issue arising from this week's review of the indicators is the relative weak state of the Primary Cycle board. While there is not an abundance of outright sell signals from my favorite big-picture indicators, the overall weakness on the board should be noted. In other words, we do not have an outright bullish situation on our hands right now and some caution may be warranted in the near term until/unless the bulls can regain their mojo.
Current Market Drivers
We strive to identify the driving forces behind the market action on a daily basis. The thinking is that if we can both identify and understand why stocks are doing what they are doing on a short-term basis; we are not likely to be surprised/blind-sided by a big move. Listed below are what we believe to be the driving forces of the current market (Listed in order of importance).
1. The State of the "Trump Trade"
2. The State of Global Central Bank Policies
3. The State of U.S. Dollar
4. The State of Bond Yields
Thought For The Day:
"Have the courage to follow your heart and intuition. They somehow already know what you truly want to become. Everything else is secondary." -Steve Jobs
Wishing you green screens and all the best for a great day,

David D. Moenning
Chief Investment Officer
Sowell Management Services
Looking for a "Modern" approach to Asset Allocation and Portfolio Design?
Looking for More on the State of the Markets?
Investment Pros: Looking to modernize your asset allocations, add risk management to client portfolios, or outsource portfolio Management? Contact Eric@SowellManagement.com
Disclosures
The opinions and forecasts expressed herein are those of Mr. David Moenning and may not actually come to pass. Mr. Moenning's opinions and viewpoints regarding the future of the markets should not be construed as recommendations. The analysis and information in this report is for informational purposes only. No part of the material presented in this report is intended as an investment recommendation or investment advice. Neither the information nor any opinion expressed constitutes a solicitation to purchase or sell securities or any investment program.
Any investment decisions must in all cases be made by the reader or by his or her investment adviser. Do NOT ever purchase any security without doing sufficient research. There is no guarantee that the investment objectives outlined will actually come to pass. All opinions expressed herein are subject to change without notice. Neither the editor, employees, nor any of their affiliates shall have any liability for any loss sustained by anyone who has relied on the information provided.
The analysis provided is based on both technical and fundamental research and is provided "as is" without warranty of any kind, either expressed or implied. Although the information contained is derived from sources which are believed to be reliable, they cannot be guaranteed.
David D. Moenning is an investment adviser representative of Sowell Management Services, a registered investment advisor. For a complete description of investment risks, fees and services, review the firm brochure (ADV Part 2) which is available by contacting Sowell. Sowell is not registered as a broker-dealer.
Employees and affiliates of Sowell may at times have positions in the securities referred to and may make purchases or sales of these securities while publications are in circulation. Positions may change at any time.
Investments in equities carry an inherent element of risk including the potential for significant loss of principal. Past performance is not an indication of future results.
Advisory services are offered through Sowell Management Services.
Recent free content from FrontRange Trading Co.
-
 Is The Bull Argument Too Easy These Days?
— 8/31/20
Is The Bull Argument Too Easy These Days?
— 8/31/20
-
What Do The Cycles Say About 2020?
— 1/21/20
-
Modeling 2020 Expectations (Just For Fun)
— 1/13/20
-
Tips From Real-World Wendy Rhoades
— 5/06/19
-
The Best Recession Ever!
— 4/29/19
-
{[comment.author.username]} {[comment.author.username]} — Marketfy Staff — Maven — Member


- 1 Campus Martius, Suite #200Detroit, MI 48226
- +1 877 440 9464