

Indicator Review: What A Difference A Week Makes
Good Monday morning and welcome back. What a difference a week makes, right? Last week, we were talking about the fact that stocks were in a clearly defined, intermediate-term downtrend and looking at how low the market indices could go. But after the surprise election result, the focus has turned to the "Trump Trades," increased economic growth, and higher inflation down the road. As a result, the new leadership pushed the DJIA to a new all-time and the rest of the major indices back into the middle of their respective trading ranges.
But enough of my subjective analysis. As we do each week, let's review our major stock market indicators in order to get a disciplined, unemotional take of what "is" happening in the market. Note that I've decided to move the discussion of the current chart action to a new report, which will be entitled "Technical Talk" and be updated each week.
The State of the Trend
We start with a look at the "state of the trend" from our objective indicator panel. These indicators are designed to give us a feel for the overall health of the current short- and intermediate-term trend models.
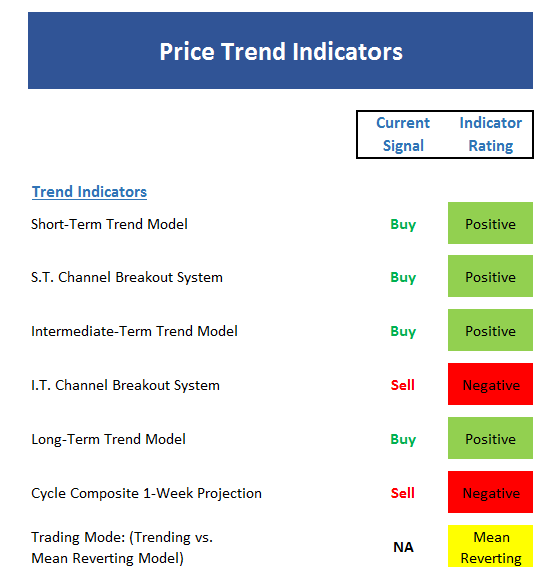
Executive Summary:
- The short-term trend has flipped from down to up
- The intermediate-term trend can be upgraded from moderately negative to neutral
- The short-term channel system is positive while the intermediate-term system remains negative
- There has been no change to the long-term trend model - still positive
- The cycle composite suggests that tax-selling season is upon us and points to slightly lower prices for the next two weeks
- The "mode" of the market has been upgraded to "mean reverting" from "trending lower"
- It is positive that the DJIA stepped lively to a fresh all-time high on the back of the banks
The State of Internal Momentum
Now we turn to the momentum indicators...
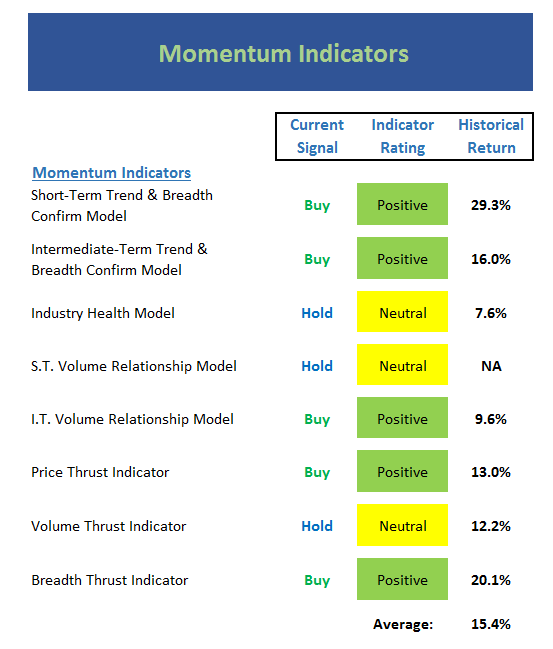
Executive Summary:
- Due to the surge seen post-election in the "Trump Trade" areas (banks, biotech, healthcare, defense, infrastructure, etc.) the momentum board has done a quick U-Turn and is now in pretty good shape
- Both short- and intermediate-term trend & breadth models flipped to positive this week
- The industry health model wasn't terribly impressed and only saw a modest uptick on the week (the rotation out of tech into the "Trump Trade" areas is likely to blame
- The volume relationship models saw improvement this week thanks to the blast in certain areas and we should note that the short-term model is on the brink of turning green
- The historical return is well above the long-term mean
- The improvement in the internals removes a major bullet point from the bear argument
The State of the "Trade"
Next up is the "early warning" board, which is designed to indicate when traders may start to "go the other way" -- for a trade.
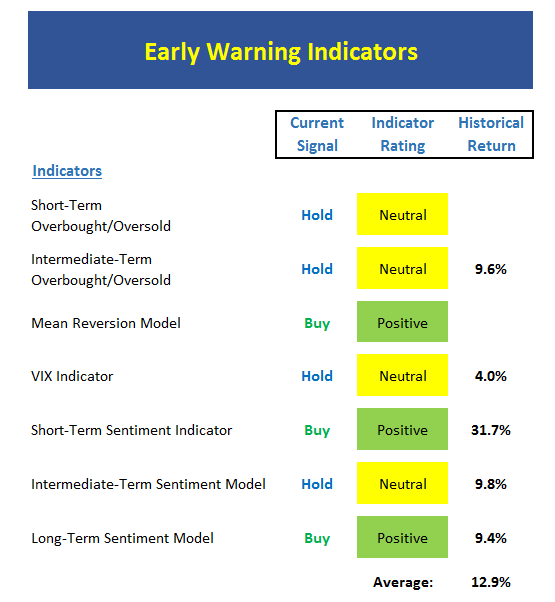
Executive Summary:
- Given the violent reversal in the market post-election, the early warning board is actually still in pretty good shape
- This argues that stocks are not extended and that the bulls may have some room to run
- On a very short-term basis, stocks are very close to an overbought "pause" signal, which suggests that a modest pullback would be normal
- From an intermediate-term perspective, the market is neither overbought nor oversold. Again, this means the bulls have some room to work
- Investor sentiment became quite negative (which shows up as green on this board) over the last two months
- The level of pessimism seen in the sentiment models has not yet been "worked off"
- This board suggests dip-buyers may be active in the near-term
The State of the Macro Picture
Now let's move on to the market's "external factors" - the indicators designed to tell us the state of the big-picture market drivers including monetary conditions, the economy, inflation, and valuations.
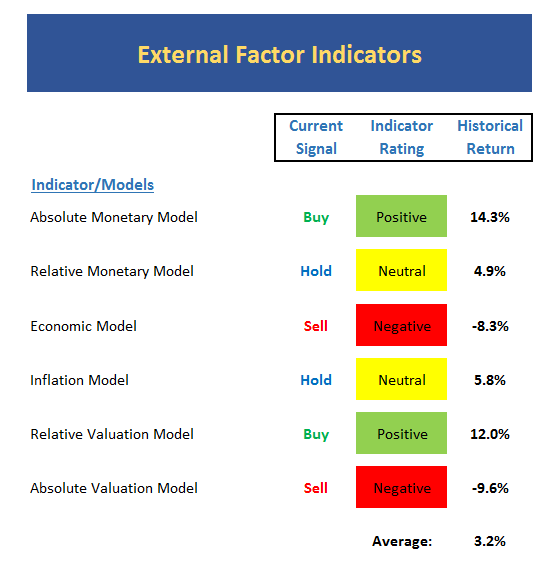
Executive Summary:
- The key to this board is it is not influenced much by price movement
- With rates spiking, the monetary picture is weakening but there has been no change in the models
- As I reported last week, the economic model (which is designed to "call" the stock market, is now squarely in the red zone
- The inflation expectations model remains neutral, but the trend of the model readings is clearly moving from the lower left to the upper right on the chart
- The relative valuation model has pulled back a bit in response to the spike in rates, but remains in the positive zone for now
- Believe it or not, the recent "sloppy period" helped the absolute valuation levels - but not enough to move the model out of the negative zone
- We are continuing to watch the monetary and valuation situations closely and note that the historical return level is fairly weak at this time
The State of the Big-Picture Market Models
Finally, let's review our favorite big-picture market models, which are designed to tell us which team is in control of the prevailing major trend.
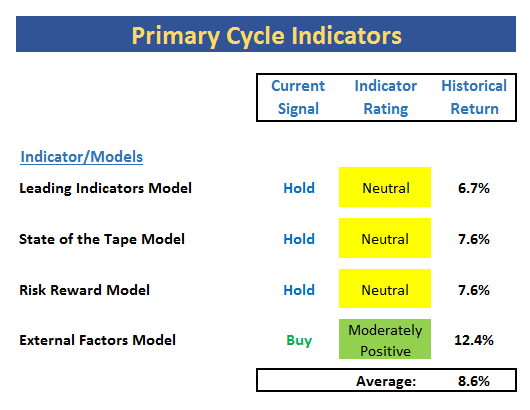
Executive Summary:
- The two-month pullback caused some damage to our Primary Cycle models
- Three of the four models are now neutral
- The good news is the External Factors model remains in pretty good shape
- But if rates continue to rise, look for this board to weaken further
- The historical return is still solid, suggesting the bulls should be given the benefit of the doubt here
The Takeaway...
The "Trump Trade" is the focal point of the market at this time. And the areas expected to benefit from the campaign promises such as the repeal of Obamacare, the renegotiation of trade agreements, the reduction of bank regulation, tax cuts and a reform of the tax code, and spending on infrastructure, have all spiked since the election as traders race to get into these positions. The good news is the trend and momentum of the market have improved nicely with the DJIA finishing the week at a new all-time high. Yes, stocks are overbought from a near-term perspective. But since stocks are coming off a two-month pullback, the bulls would appear to still have some room to run. And with the calendar starting to run out of days, a buy-the-dip mentality may help the traditional year-end rally bring good cheer to the upcoming holiday season.
Publishing Note: I am traveling the rest of the week. Thus, reports will be published as my schedule permits.
Current Market Drivers
We strive to identify the driving forces behind the market action on a daily basis. The thinking is that if we can both identify and understand why stocks are doing what they are doing on a short-term basis; we are not likely to be surprised/blind-sided by a big move. Listed below are what we believe to be the driving forces of the current market (Listed in order of importance).
1. The State of the "Trump Trade"
2. The State of Global Central Bank Policies
3. The State of Global Economies
3. The State of Interest Rates
Thought For The Day:
Peace hath higher tests of manhood than battle ever knew -J Whittier
Wishing you green screens and all the best for a great day,

David D. Moenning
Chief Investment Officer
Sowell Management Services
Looking for a "Modern" approach to Asset Allocation and Portfolio Design?
Looking for More on the State of the Markets?
Investment Pros: Looking to modernize your asset allocations, add risk management to client portfolios, or outsource portfolio design? Contact Eric@SowellManagement.com
Disclosures
The opinions and forecasts expressed herein are those of Mr. David Moenning and may not actually come to pass. Mr. Moenning's opinions and viewpoints regarding the future of the markets should not be construed as recommendations. The analysis and information in this report is for informational purposes only. No part of the material presented in this report is intended as an investment recommendation or investment advice. Neither the information nor any opinion expressed constitutes a solicitation to purchase or sell securities or any investment program.
Any investment decisions must in all cases be made by the reader or by his or her investment adviser. Do NOT ever purchase any security without doing sufficient research. There is no guarantee that the investment objectives outlined will actually come to pass. All opinions expressed herein are subject to change without notice. Neither the editor, employees, nor any of their affiliates shall have any liability for any loss sustained by anyone who has relied on the information provided.
The analysis provided is based on both technical and fundamental research and is provided "as is" without warranty of any kind, either expressed or implied. Although the information contained is derived from sources which are believed to be reliable, they cannot be guaranteed.
David D. Moenning is an investment adviser representative of Sowell Management Services, a registered investment advisor. For a complete description of investment risks, fees and services, review the firm brochure (ADV Part 2) which is available by contacting Sowell. Sowell is not registered as a broker-dealer.
Employees and affiliates of Sowell may at times have positions in the securities referred to and may make purchases or sales of these securities while publications are in circulation. Positions may change at any time.
Investments in equities carry an inherent element of risk including the potential for significant loss of principal. Past performance is not an indication of future results.
Advisory services are offered through Sowell Management Services.
Recent free content from FrontRange Trading Co.
-
 Is The Bull Argument Too Easy These Days?
— 8/31/20
Is The Bull Argument Too Easy These Days?
— 8/31/20
-
What Do The Cycles Say About 2020?
— 1/21/20
-
Modeling 2020 Expectations (Just For Fun)
— 1/13/20
-
Tips From Real-World Wendy Rhoades
— 5/06/19
-
The Best Recession Ever!
— 4/29/19
-
{[comment.author.username]} {[comment.author.username]} — Marketfy Staff — Maven — Member


- 1 Campus Martius, Suite #200Detroit, MI 48226
- +1 877 440 9464