

Indicator Review: Time To Get Fooled Again?
Good Monday morning and welcome back. The best news of the week is that the election is FINALLY upon us. Politics aside, here's hoping we get an outcome that doesn't "surprise" the market on Wednesday morning. So while we wait, let's start the week off right by reviewing the state of our major indicators and models.
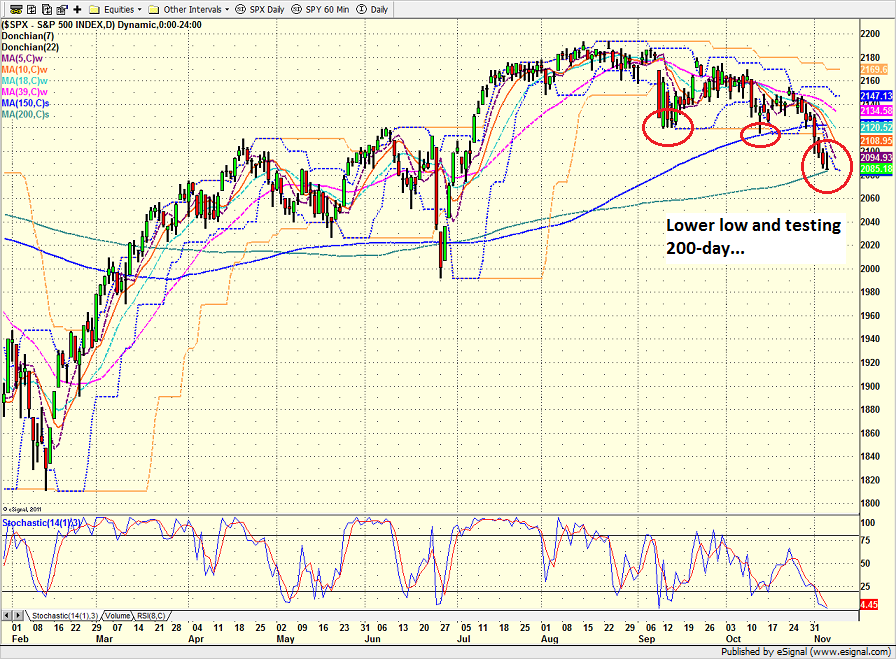
The first step I like to take is to review the price/trend of the market. Here's my purely subjective take on the current state of the technical picture...
- There can be little argument that stocks are in a downtrend
- The S&P 500 has put in a lower-low on the daily chart
- Important support at 2120 was violated last week
- The S&P is now testing the 200-day
- The S&P has now fallen 9 consecutive days in a row, something that hasn't happened since 1980
- During the decline the S&P has dropped -3.07%
- The decline from the August high now stands at -4.79%
S&P 500 - Daily 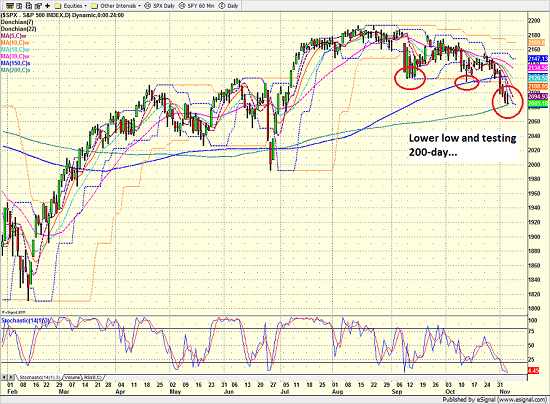
View Larger Image
From a longer-term perspective (e.g. looking at a weekly chart of the S&P 500)...
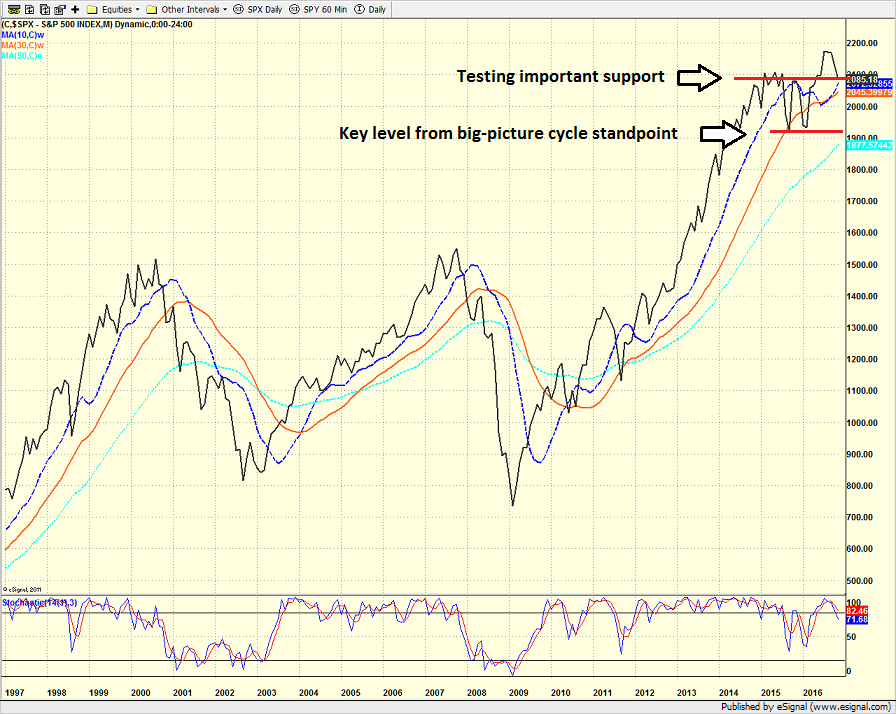
- This week, I've decided to take an even bigger "step back" and I am looking at a MONTHLY chart of the S&P
- This helps keep the major cycle in perspective
- The S&P is now testing important support on a monthly basis
- The index is also testing it's 10-month simple moving average at this time - something many technical analysts follow (the 10-month I prefer and show on the chart is a weighted MA that has been moved forward 4 months)
- The key level closing level from a longer-term perspective is 1920
- A meaningful and lasting breach of this level would likely mean a cyclical bear market had begun
- The bulls would prefer to see the S&P remain above 2100 on the monthly chart
S&P 500 - Weekly 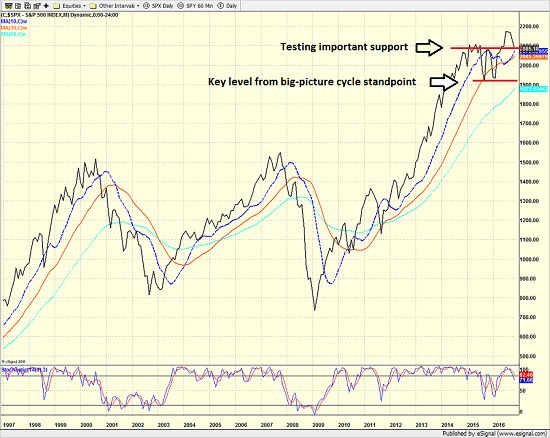
View Larger Image
Next, let's remove the subjectivity and look at the "state of the trend" from our objective indicator panel. These indicators are designed to give us a feel for the overall health of the current short- and intermediate-term trend models.
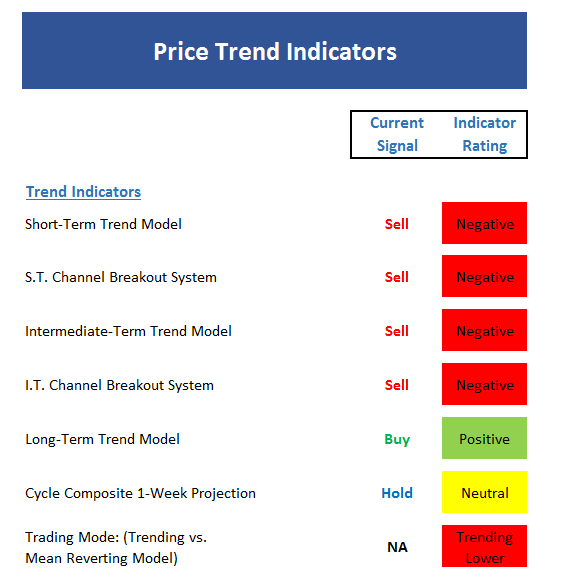
- As is to be expected after a slow and steady decline that is now almost 3 months old, there is a lot of red here
- All of our trend and channel breakout systems are negative at this time
- The longer-term trend model remains positive and is not at risk of flipping to negative at this time
- The cycle composite actually points down slightly for the week
- It is important to note that our Trading Mode model has changed to "Trending Lower" mode
- In the "Trending Lower" mode, I believe it is best for traders to lengthen out their time frame and ignore short-term moves - especially the first bounce
Now we turn to the momentum indicators...
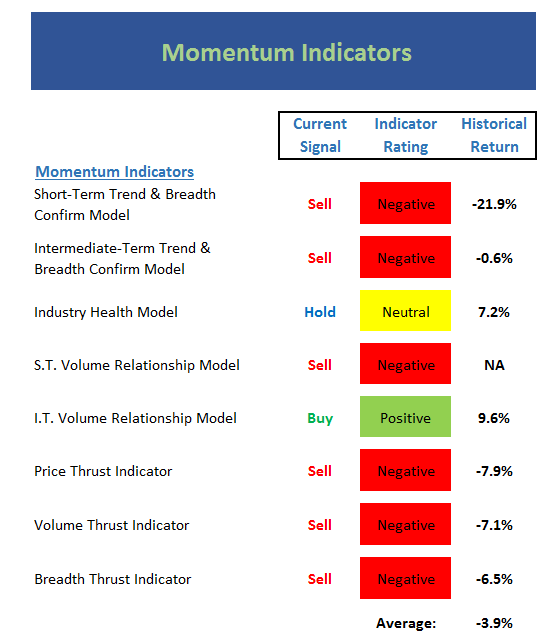
- The first point to keep in mind here is that momentum indicators have been consistently "fooled" since 2011
- In other words, weakness has not necessarily let to more weakness
- Instead, lots of red on the momentum board has more often than not been a sign of a meaningful oversold condition
- The longer-term volume relationship model remains positive
- The industry health model continues to weaken but remains in the neutral zone at this time
- The reading of the historical return of the board is now negative
- I am looking at this board with a skeptical eye at this time
Next up is the "early warning" board, which is designed to indicate when traders may start to "go the other way" -- for a trade.
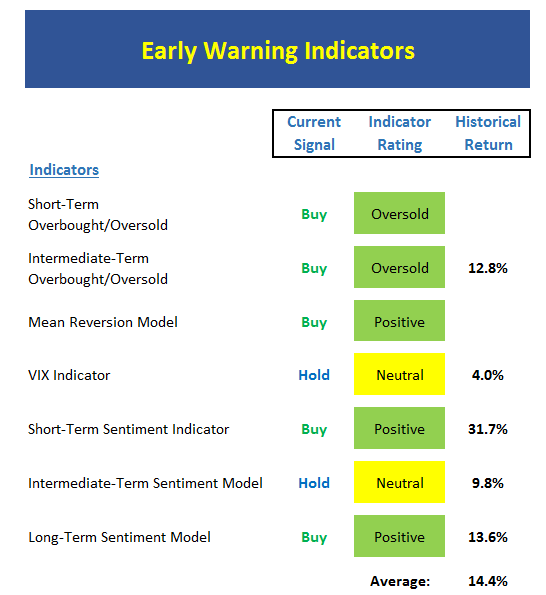
- This board is another down day or so away from being completely green
- This tells us that "the stars are now aligned" for a rebound
- The mean reversion model finally found a spot to go long
- The VIX models are VERY close to issuing buy signals
- Sentiment has become negative
- Bottom Line: IMO, dip buyers should be standing at the ready or taking initial positions
Now let's move on to the market's "external factors" - the indicators designed to tell us the state of the big-picture market drivers including monetary conditions, the economy, inflation, and valuations.
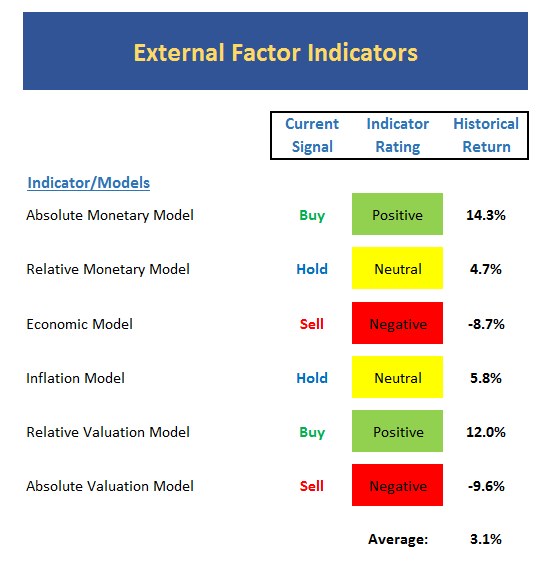
- The economic model (a model using economic indicators to "call" the stock market) remains negative
- The inflation model (ditto) is now neutral
- This board basically tells us the external factors are no longer a strong tailwind for stocks
- In this environment, investors may need an improvement in earnings and/or the economic outlook in order for stocks to move meaningfully above the old highs
Finally, let's review our favorite big-picture market models, which are designed to tell us which team is in control of the prevailing major trend.
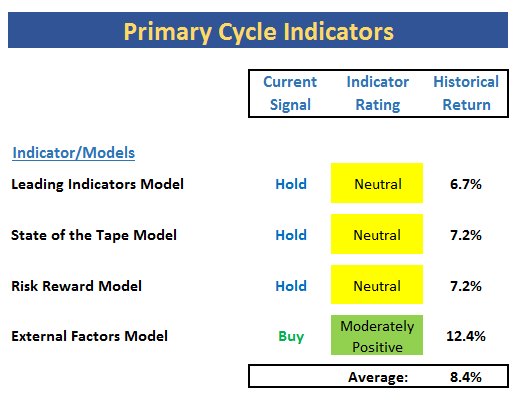
- This board is perhaps the most worrisome... and the most telling
- The leading indicators model, which did a VERY good job of issuing an advance warning of the mini bear that occurred between August 2015 and February 2016 moved to neutral last week.
- However, a sell signal is NOT given until the model goes negative
- The fact that three of the four models are neutral should be noted
- It is also worth noting that the average historical return is now below the market's long-term average of approximately 10%
- The bottom line is that none of the models sport purely positive readings at this time
The Takeaway...
The stock market is in a downtrend and it is disconcerting that bonds are falling as well. However, in my humble opinion, stocks are falling due to uncertainty over the election while bonds are dropping on the reality that the Fed is going to raise rates in December and is likely to continue raising rates in 2017. As such, bonds are "discounting" the new Fed expectations. Getting back to the matter at hand, stocks are in a downtrend, are oversold and are now primed for a bounce. The duration of the current decline is now long enough for it to have negatively impacted many of the trend and momentum models. The only question at this point is if these models will wind up betting fooled again once the election uncertainty has been removed.
Current Market Drivers
We strive to identify the driving forces behind the market action on a daily basis. The thinking is that if we can both identify and understand why stocks are doing what they are doing on a short-term basis; we are not likely to be surprised/blind-sided by a big move. Listed below are what we believe to be the driving forces of the current market (Listed in order of importance).
1. The State of the Election
2. The State of Global Economies
3. The State of Global Central Bank Policies
Thought For The Day:
Be fearful when others are greedy and greedy when others are fearful. -Warren Buffett
Wishing you green screens and all the best for a great day,

David D. Moenning
Chief Investment Officer
Sowell Management Services
Looking for a "Modern" approach to Asset Allocation and Portfolio Design?
Looking for More on the State of the Markets?
Investment Pros: Looking to modernize your asset allocations, add risk management to client portfolios, or outsource portfolio design? Contact Eric@SowellManagement.com
Disclosures
The opinions and forecasts expressed herein are those of Mr. David Moenning and may not actually come to pass. Mr. Moenning's opinions and viewpoints regarding the future of the markets should not be construed as recommendations. The analysis and information in this report is for informational purposes only. No part of the material presented in this report is intended as an investment recommendation or investment advice. Neither the information nor any opinion expressed constitutes a solicitation to purchase or sell securities or any investment program.
Any investment decisions must in all cases be made by the reader or by his or her investment adviser. Do NOT ever purchase any security without doing sufficient research. There is no guarantee that the investment objectives outlined will actually come to pass. All opinions expressed herein are subject to change without notice. Neither the editor, employees, nor any of their affiliates shall have any liability for any loss sustained by anyone who has relied on the information provided.
The analysis provided is based on both technical and fundamental research and is provided "as is" without warranty of any kind, either expressed or implied. Although the information contained is derived from sources which are believed to be reliable, they cannot be guaranteed.
David D. Moenning is an investment adviser representative of Sowell Management Services, a registered investment advisor. For a complete description of investment risks, fees and services, review the firm brochure (ADV Part 2) which is available by contacting Sowell. Sowell is not registered as a broker-dealer.
Employees and affiliates of Sowell may at times have positions in the securities referred to and may make purchases or sales of these securities while publications are in circulation. Positions may change at any time.
Investments in equities carry an inherent element of risk including the potential for significant loss of principal. Past performance is not an indication of future results.
Advisory services are offered through Sowell Management Services.
Recent free content from FrontRange Trading Co.
-
 Is The Bull Argument Too Easy These Days?
— 8/31/20
Is The Bull Argument Too Easy These Days?
— 8/31/20
-
What Do The Cycles Say About 2020?
— 1/21/20
-
Modeling 2020 Expectations (Just For Fun)
— 1/13/20
-
Tips From Real-World Wendy Rhoades
— 5/06/19
-
The Best Recession Ever!
— 4/29/19
-
{[comment.author.username]} {[comment.author.username]} — Marketfy Staff — Maven — Member


- 1 Campus Martius, Suite #200Detroit, MI 48226
- +1 877 440 9464