

There Are Three Kinds of Lies...
As the saying goes, there are three kinds of lies. Lies, damned lies, and statistics.
This age-old cliché is especially true in this business as investors of all shapes and sizes regularly use statistics to prove their point and "talk their books."
One of the most important lessons I've learned in my 30 years as a professional money manager is that you can find a statistic to prove just about anything you want. As such, it is VERY easy to produce the evidence one needs in order to prove to themselves (and others including clients, colleagues, and bosses) that their position is right - regardless of what the market may be telling them.
Nowhere can my point be better made than the subject valuations in the stock market. To be sure, this is a "yea, but" type of situation in which every point should (if you are being objective) contain a counterpoint.
For example, I have opined many times over the past year or so that stocks are overvalued using traditional valuation metrics but undervalued when views through a relative valuation lense.
A similar situation exists when one cherry picks the time frame for the argument.
For example, I recently sat in on a talk given by a very respected, high profile fund manager at a conference. The point this gentleman made was that stocks were NOT overvalued at the present time. And to prove his point, he showed a chart of the Price-to-Earnings ratio over the last 25+ years.
Sure enough, when the chart hit the screen, the audience had to agree. There it was, plain as day, right in front of our faces; proof that valuations weren't a problem.
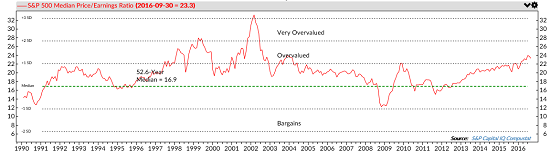
Below is an example of this type of argument. Let's look at the median P/E ratio of the S&P 500 since 1990.
View Larger Image
Source: Ned Davis Research
What's the problem here, right? What is everybody so darned worried about? After all, the current reading looks to be somewhere in the middle of the range showed on the chart. And the P/E is nowhere near the danger zones seen in 1999!
Problem number one with this analysis is that one needs to understand the math involved on the chart. The high point of the P/E shown here was actually seen in 2002, which was well after the manic peak in stock prices seen in 2000 and after the stock market had plunged in response to the tech bubble bursting.
The key here is to understand that while the P in the P/E ratio took a big hit from 2000-02, earnings (the E in the formula) got hit even harder. So, despite the big decline in the stock market, the P/E ratio actually surged after the bear market was well underway. Thus, the uber-high P/E in 2002 was not a precursor of things to come, rather a reflection of what had already happened.
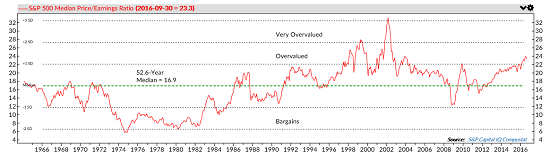
The next big problem is the fact that the speaker in this case definitely cherry picked the time-frame chosen. The chart below shows the exact same indicator as above. But instead of going back 25 years, it goes back 50+ years.
View Larger Image
Source: Ned Davis Research
In my humble opinion, this chart provides a very different perspective.
Yes, it is true that the current reading is not as high as it was in 2002 or the late 1990's when the tech bubble was raging. However, if one removes the artificial spike that occurred due to massive bear in 2002 and the once-in-a-lifetime bubble period, you will find that the current reading is higher than any other point.
The current reading of the median P/E ratio is higher than it was in 2008. And 1990. And 1987. And 1972. Hmmm.
Before you run out and start loading up on those leveraged inverse ETFs and hunkering down for the next big, bad bear market, it is also important to remember that in the stock market "things don't matter until they do (and then they matter a lot)."
And given (a) the level of interest rates, (b) the fact that the economy continues to grow and there is little chance of a recession, and (c) M&A activity has been heating up lately, my take is that valuations don't seem to matter much right now to investors.
Now... If one takes global QE money out of the mix and stirs in an economic slowdown, rising inflation and much higher rates, well, that's a different recipe altogether. But the point is we aren't there yet. And as such, I don't think we need to worry about valuations when looking at the intermediate-term time frame.
Publishing Note:I am traveling the rest of the week (we are visiting our first grandchild, who turned one month old this week) and will not publish a report on Friday. Have a great weekend!
Current Market Drivers
We strive to identify the driving forces behind the market action on a daily basis. The thinking is that if we can both identify and understand why stocks are doing what they are doing on a short-term basis; we are not likely to be surprised/blind-sided by a big move. Listed below are what we believe to be the driving forces of the current market (Listed in order of importance).
1. The State of the Earnings Season
2. The State of Global Economies
3. The State of Global Central Bank Policies
4. The State of U.S. Dollar
Thought For The Day:
The most important thing in communication is to hear what isn't being said. -Peter Drucker
Wishing you green screens and all the best for a great day,

David D. Moenning
Chief Investment Officer
Sowell Management Services
Looking for a "Modern" approach to Asset Allocation and Portfolio Design?
Looking for More on the State of the Markets?
Investment Pros: Looking to modernize your asset allocations, add risk management to client portfolios, or outsource portfolio design? Contact Eric@SowellManagement.com
Disclosures
The opinions and forecasts expressed herein are those of Mr. David Moenning and may not actually come to pass. Mr. Moenning's opinions and viewpoints regarding the future of the markets should not be construed as recommendations. The analysis and information in this report is for informational purposes only. No part of the material presented in this report is intended as an investment recommendation or investment advice. Neither the information nor any opinion expressed constitutes a solicitation to purchase or sell securities or any investment program.
Any investment decisions must in all cases be made by the reader or by his or her investment adviser. Do NOT ever purchase any security without doing sufficient research. There is no guarantee that the investment objectives outlined will actually come to pass. All opinions expressed herein are subject to change without notice. Neither the editor, employees, nor any of their affiliates shall have any liability for any loss sustained by anyone who has relied on the information provided.
The analysis provided is based on both technical and fundamental research and is provided "as is" without warranty of any kind, either expressed or implied. Although the information contained is derived from sources which are believed to be reliable, they cannot be guaranteed.
David D. Moenning is an investment adviser representative of Sowell Management Services, a registered investment advisor. For a complete description of investment risks, fees and services, review the firm brochure (ADV Part 2) which is available by contacting Sowell. Sowell is not registered as a broker-dealer.
Employees and affiliates of Sowell may at times have positions in the securities referred to and may make purchases or sales of these securities while publications are in circulation. Positions may change at any time.
Investments in equities carry an inherent element of risk including the potential for significant loss of principal. Past performance is not an indication of future results.
Advisory services are offered through Sowell Management Services.
Recent free content from FrontRange Trading Co.
-
 Is The Bull Argument Too Easy These Days?
— 8/31/20
Is The Bull Argument Too Easy These Days?
— 8/31/20
-
What Do The Cycles Say About 2020?
— 1/21/20
-
Modeling 2020 Expectations (Just For Fun)
— 1/13/20
-
Tips From Real-World Wendy Rhoades
— 5/06/19
-
The Best Recession Ever!
— 4/29/19
-
{[comment.author.username]} {[comment.author.username]} — Marketfy Staff — Maven — Member


- 1 Campus Martius, Suite #200Detroit, MI 48226
- +1 877 440 9464