

Indicator Review: Dazed and Confused
Good Monday morning and welcome to the home stretch of 2016. Before we let the blinking screens take over our lives on the first first day of Q4, let's step back and start the week with a review of the state of the market and our objective major market indicators/models.
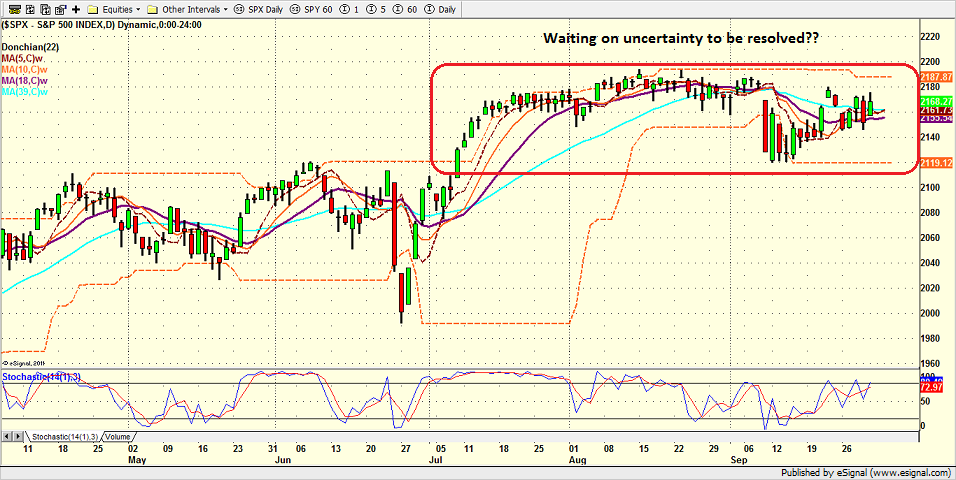
The first step is a review of the price/trend of the market. Here's my current take on the state of the technical picture...
- Stocks have been moving in a sideways manner since the middle of July
- And if you go back to April 1, the indices have been moving sideways in two defined ranges - separated by the BREXIT freak-out and recovery
- Key short-term line in the sand is 2119
- Key resistance is 2193
- It would appear that traders are waiting on some of the uncertainties (Deutsche, election, earnings, etc) to be resolved
- A break in either direction will undoubtedly bring in technical buying/selling
- Don't forget that earnings season begins in earnest again soon...
S&P 500 - Daily 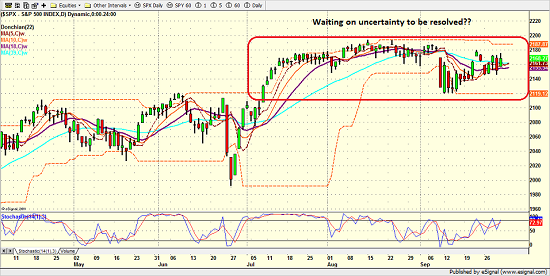
View Larger Image
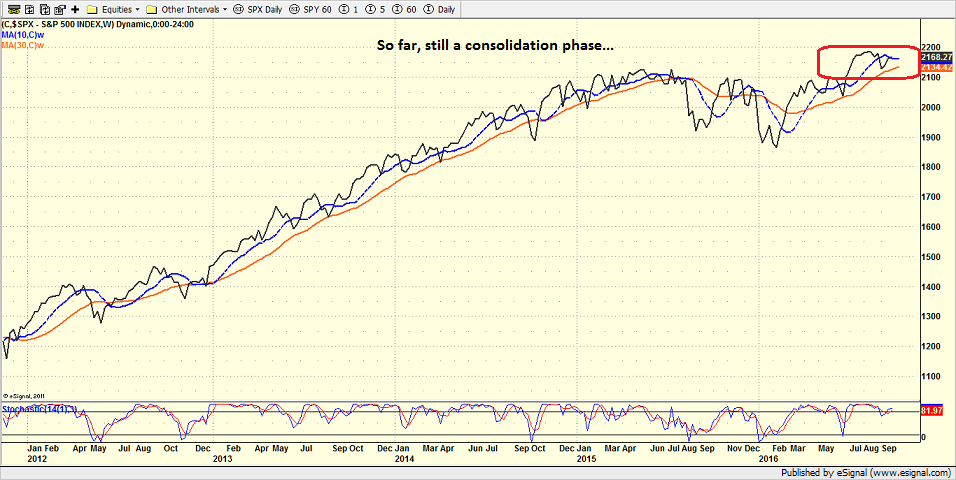
From a longer-term perspective (e.g. looking at a weekly chart of the S&P 500)...
- The current thinking is that a "mini bear" ended on February 11, 2016 and that a new bull began thereafter
- The bulls argue that the current sideways action is simply the "pause that refreshes"
- So far, the S&P weekly looks to be in a consolidation phase
- A weekly close below 2100 would be problematic
- A weekly close below 2037 would be a bigger problem
S&P 500 - Weekly 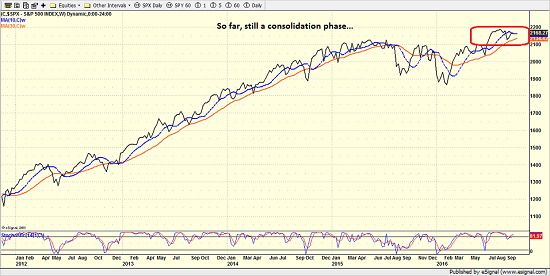
View Larger Image
Next, let's look at the "state of the trend" from our indicator panel. These indicators are designed to give us a feel for the overall health of the current short- and intermediate-term trend models.
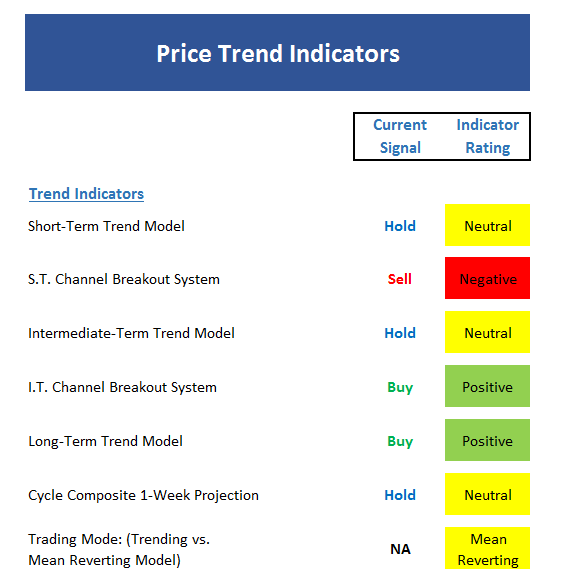
- The board isn't that helpful here as the indicators have been flip-flopping a lot lately
- Short- and intermediate-term channel systems are conflicted
- Cycle composite is sideways for the next week
- The market has returned to a mean-reverting mode
- The longer-term trend remains in good shape
Now we turn to the momentum indicators...
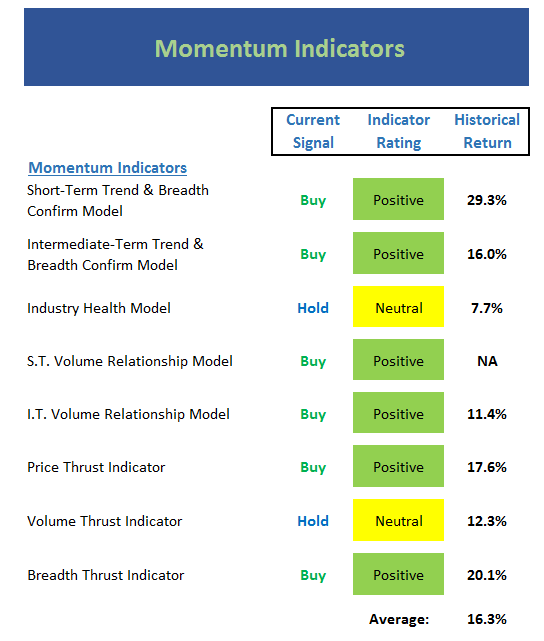
- Similar story with the momentum board
- The overall board looks green, but...
- There is little conviction in the models at this stage
- One bad down day will change the color of the overall board
- However, we will note that the volume relationship models remain positive
Next up is the "early warning" board, which is designed to indicate when traders may start to "go the other way" -- for a trade.
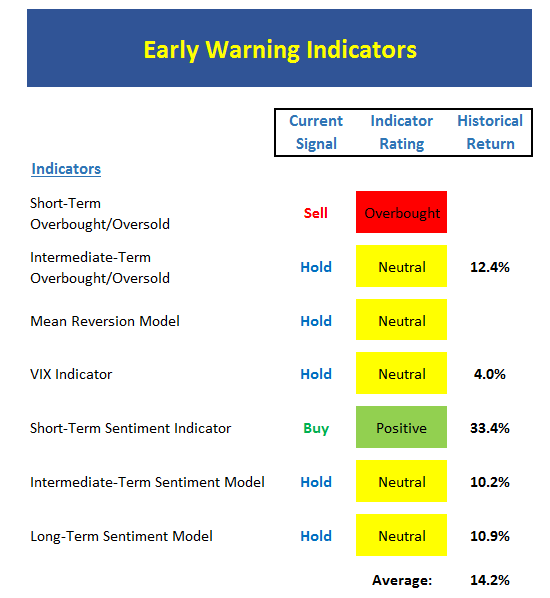
- The early warning board paints a good picture here
- Short-term, stocks are close to an overbought condition again
- Intermediate-term, stocks are coming off an oversold condition and are now neutral
- Longer-term, the market remains overbought
- There is no consensus from the sentiment models
- However, the worry over Deutsche Bank could easily cause sentiment to weaken
Now let's move on to the market's "external factors" - the indicators designed to tell us the state of the big-picture market drivers including monetary conditions, the economy, inflation, and valuations.
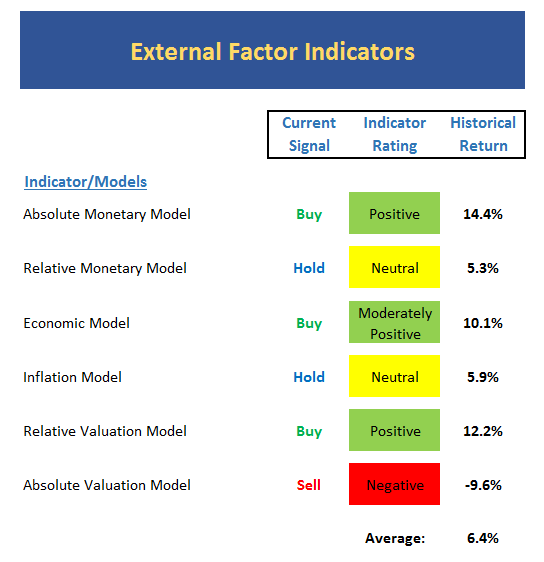
- The relative monetary model downticked to neutral last week
- The economic model also moved lower last week - although the mode did not change (still moderately positive)
- One of the inflation component models upticked into the "moderate inflation" mode last week
- Absolute valuation remains a problem and will gain attention if the bears gain the upper hand
Finally, let's review our favorite big-picture market models, which are designed to tell us which team is in control of the prevailing major trend.
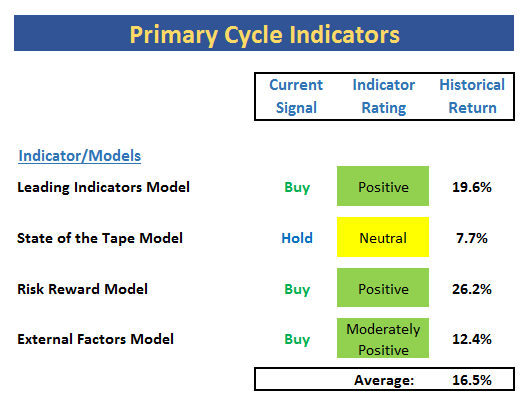
- The mode of the leading indicators model is unchanged, but the reading downticked to 70%
- The risk/reward model has been flip-flopping over last 3 weeks. Currently positive
- The state of the tape model remains a concern
The Takeaway...
With the worries over the state of Germany's banks taking center stage, the major indices have been pushed/pulled by the day's trading in stocks like Deutsche Bank. In addition, issues such as the election and the state of the earnings season are also weighing on traders' minds and creating uncertainty. Thus, until this uncertainty becomes resolved, the sideways action, which creates confusion on the indicator boards, is likely to continue.
Current Market Drivers
We strive to identify the driving forces behind the market action on a daily basis. The thinking is that if we can both identify and understand why stocks are doing what they are doing on a short-term basis; we are not likely to be surprised/blind-sided by a big move. Listed below are what we believe to be the driving forces of the current market (Listed in order of importance).
1. The State of German/European Banks
2. The State of Global Central Bank Policies
3. The State of U.S. Economic Growth
Thought For The Day:
The meaning of life is to give life a meaning. -- Unknown
Wishing you green screens and all the best for a great day,

David D. Moenning
Chief Investment Officer
Sowell Management Services
Looking for a "Modern" approach to Asset Allocation and Portfolio Design?
Looking for More on the State of the Markets?
Investment Pros: Looking to modernize your asset allocations, add risk management to client portfolios, or outsource portfolio design? Contact Eric@SowellManagement.com
Disclosures
The opinions and forecasts expressed herein are those of Mr. David Moenning and may not actually come to pass. Mr. Moenning's opinions and viewpoints regarding the future of the markets should not be construed as recommendations. The analysis and information in this report is for informational purposes only. No part of the material presented in this report is intended as an investment recommendation or investment advice. Neither the information nor any opinion expressed constitutes a solicitation to purchase or sell securities or any investment program.
Any investment decisions must in all cases be made by the reader or by his or her investment adviser. Do NOT ever purchase any security without doing sufficient research. There is no guarantee that the investment objectives outlined will actually come to pass. All opinions expressed herein are subject to change without notice. Neither the editor, employees, nor any of their affiliates shall have any liability for any loss sustained by anyone who has relied on the information provided.
The analysis provided is based on both technical and fundamental research and is provided "as is" without warranty of any kind, either expressed or implied. Although the information contained is derived from sources which are believed to be reliable, they cannot be guaranteed.
David D. Moenning is an investment adviser representative of Sowell Management Services, a registered investment advisor. For a complete description of investment risks, fees and services, review the firm brochure (ADV Part 2) which is available by contacting Sowell. Sowell is not registered as a broker-dealer.
Employees and affiliates of Sowell may at times have positions in the securities referred to and may make purchases or sales of these securities while publications are in circulation. Positions may change at any time.
Investments in equities carry an inherent element of risk including the potential for significant loss of principal. Past performance is not an indication of future results.
Advisory services are offered through Sowell Management Services.
Recent free content from FrontRange Trading Co.
-
 Is The Bull Argument Too Easy These Days?
— 8/31/20
Is The Bull Argument Too Easy These Days?
— 8/31/20
-
What Do The Cycles Say About 2020?
— 1/21/20
-
Modeling 2020 Expectations (Just For Fun)
— 1/13/20
-
Tips From Real-World Wendy Rhoades
— 5/06/19
-
The Best Recession Ever!
— 4/29/19
-
{[comment.author.username]} {[comment.author.username]} — Marketfy Staff — Maven — Member


- 1 Campus Martius, Suite #200Detroit, MI 48226
- +1 877 440 9464