

Sometimes Things Make Sense
Good morning and welcome back. Every once in a great while, the stock market game makes sense. From my seat, this just may be one of those times. You see, Friday's jobs report, which was much, much better than expected, suggests that the economy is better than the glass-is-half-empty gang would have us believe. In turn, more jobs and higher wages means a brighter outlook for both the economy and earnings going forward. Which, of course, means stock prices can move higher in this new bull market. Maybe not today or this week. But if one looks out toward the end of the year, I'm of the mind that you've got to side with the bulls here.
Since it's Monday, let's move on to our review of the state of the market and our major market indicators/models.
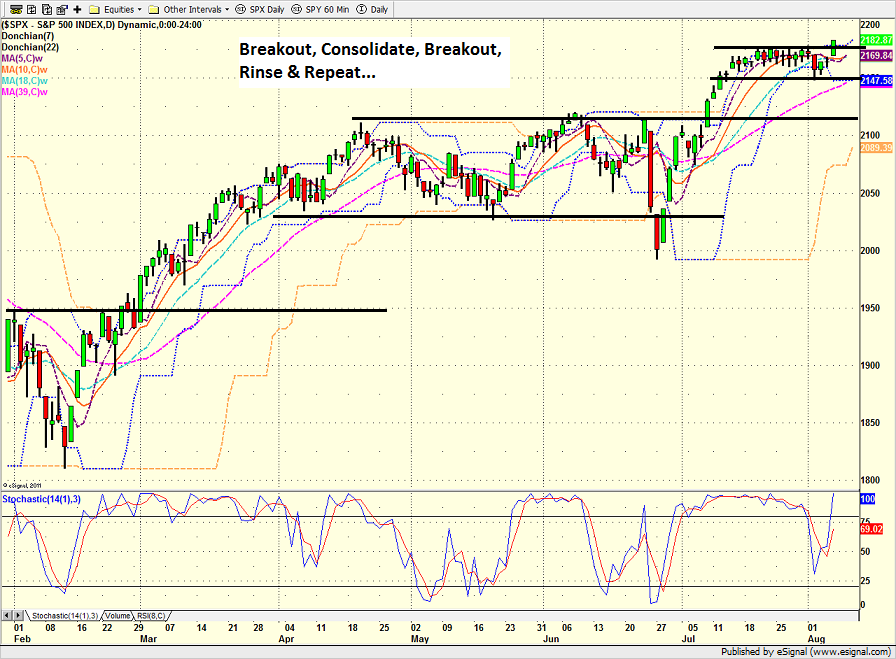
As usual, the first stop is a review of the price/trend of the market. Here's my current take on the state of the technical picture...
- As I mentioned last time, the most bullish thing a market can do is make new highs. Check.
- The recent trend has been clear: Stocks break out of a consolidation zone (on good economic news or central bank intervention), move higher (despite all the worries), consolidate (due to more worries), and then rinse & repeat.
- Old resistance (at S&P 2175) becomes new support from near-term perspective
- We should expect this zone to be tested
- Experience tells me this is when the bears get fooled
- We still need to watch oil and rates
- But for now, this remains a buy-the-dip (any dip) environment
S&P 500 - Daily 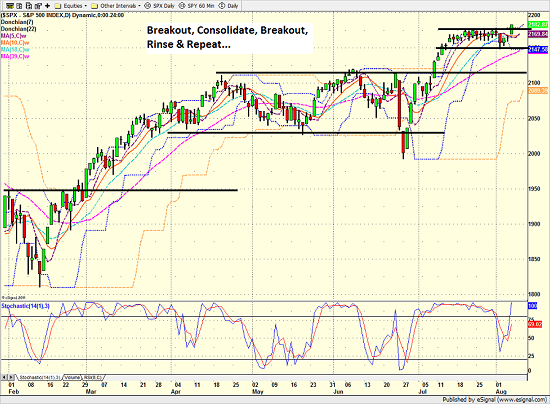
View Larger Image
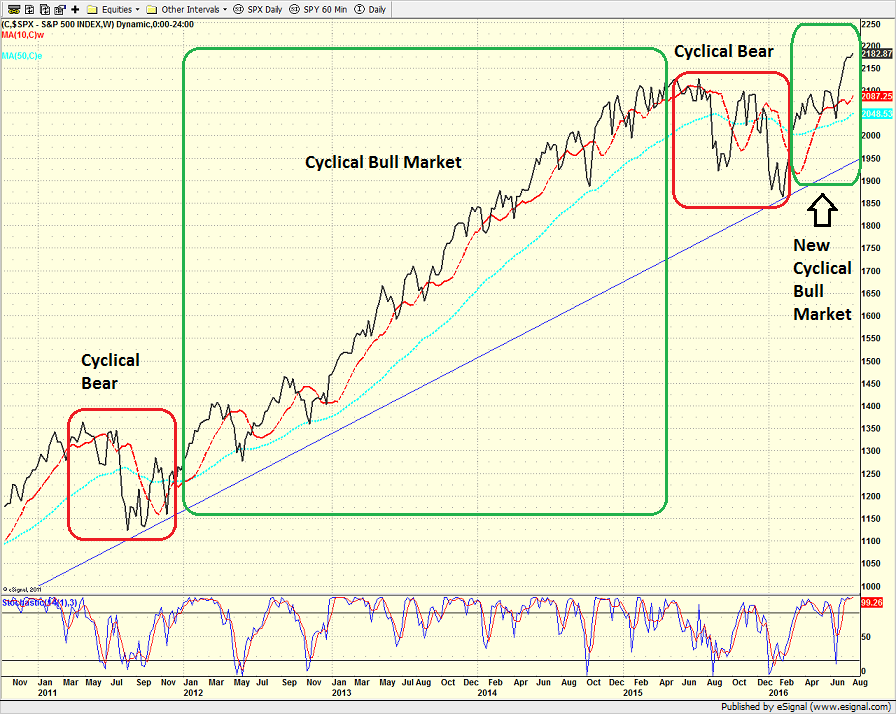
From a longer-term perspective (e.g. looking at a weekly chart of the S&P 500)...
- Ned Davis Research tells us a new cyclical bull market was officially confirmed on Tuesday, July 19
- The start date for this new bull was February 11, 2016
- NDR also contends that stocks remain in the secular bull market that began March 9, 2009
- History shows that the cyclical bears that occur within a secular bull are shorter and shallower than normal
- This was certainly the case in 2011 and again from August 2015 through February 11, 2016.
- NDR says average gain for a cyclical bull within a secular bull is 106%
- Current gain from 2/11 low is 19.3%.
- So, if history holds...
S&P 500 - Weekly 
View Larger Image
Here's the view of the "state of the trend" from our indicator panel.
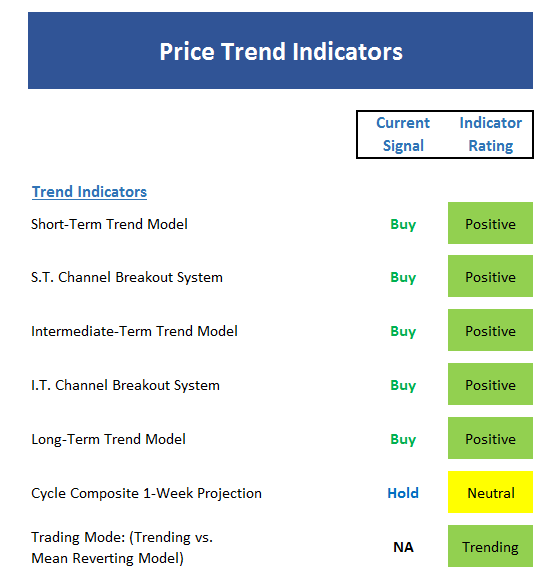
- Not much to complain about here...
- The only possible negative is the seasonal cycle gets very sloppy soon
- Cycle composite says up into mid-August then down into early October
- Our primary trading mode model (trending vs. mean reverting) finally flipped to trending last week. I'd like to see the other two models I follow confirm in the next couple of weeks.
- For all the naysayers and bearish nonbelievers, remember that there are times when "the trend is your friend"
Next up is the momentum indicator board...
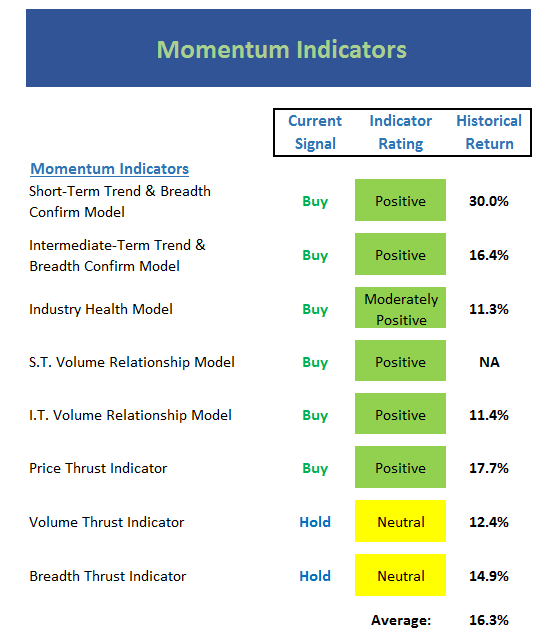
- The difference between the current run for the roses and rest of the rally attempts that have occurred since the fall of 2014 is this time around, the bulls have momentum on their side
- As we've mentioned many times recently, the market has produced several "thrust" buy signals since the BREXIT low
- I would prefer to see our Industry Health model in a purely positive mode (it is currently rated moderately positive)
- It is normal for the Volume and Breadth Thrust Indicators to pull back into neutral territory after giving buy signals - i.e. this is not a reason for alarm
- The historical return of the momentum board is well above average
Next up is the "early warning" board, which is designed to indicate when traders may start to "go the other way" for a trade.
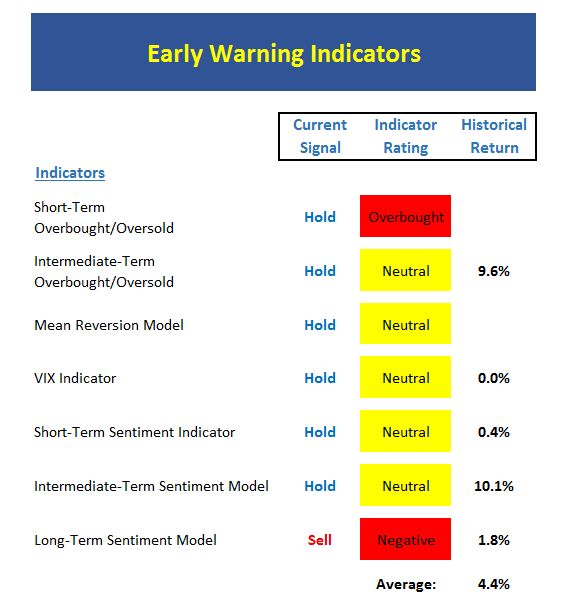
- We've talked a lot about the idea of a "good overbought condition" (a sign of strength) and IMO, this appears to be the case here as stocks have gotten overbought and stayed overbought since the BREXIT vote.
- The message from the rest of this board is simple: A pullback "could" begin at any time
- Short- and intermediate-term sentiment is not extremely positive here (a good thing)
Now let's move on to the market's "external factors" - the indicators designed to tell us the state of the big-picture market drivers including monetary conditions, the economy, inflation, and valuations.
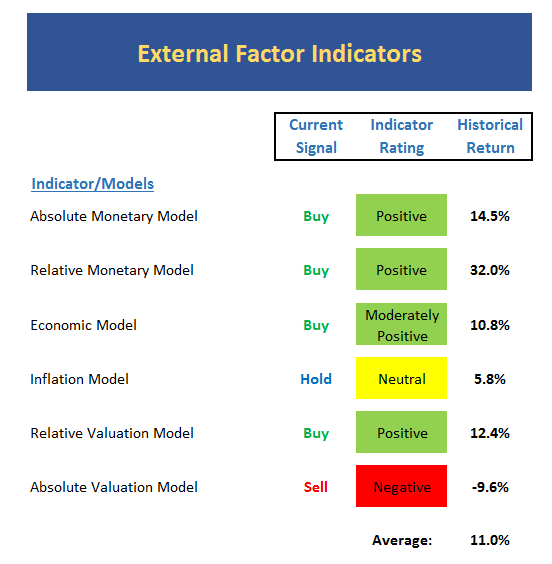
- While the rating/color of the Relative Monetary Model hasn't changed, the historical return has improved dramatically. Thus, we must recognize that monetary conditions remain favorable.
- The Economic Model is going the wrong way right now but remains in a mode where stocks have historically done well
- The signal isn't new this week, but I continue to take note of the trend of the inflation model
- Valuation is still a judgement call. In short it's either good or very bad. In my experience, valuations don't matter until they do.
Finally, let's turn to our favorite big-picture market models, which are designed to tell us which team is in control of the prevailing major trend.
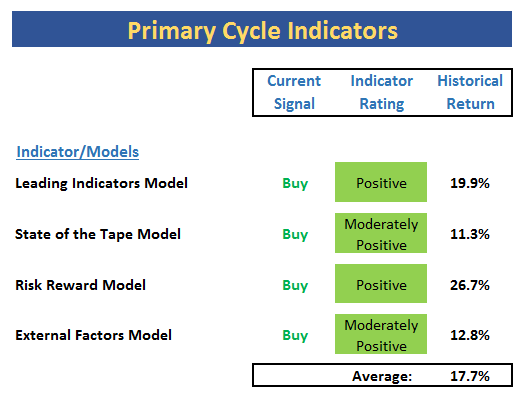
- All of my favorite big-picture models are green
- The historical returns of my favorite big-picture models are all above the mean
- 'Nuf said
The Takeaway...
For me, the takeaways from this week's work are as follows: (a) the trend is up, (b) momentum favors the bulls, (c) the jobs report provides a tailwind for the macro crowd, (d) the seasonal cycle suggest things will start to get sloppy soon, (e) stocks are short-term overbought, and (f) it's a bull market. Thus, the indicator boards tell me to give the bulls the benefit of any doubt and to buy the dips.
Current Market Drivers
We strive to identify the driving forces behind the market action on a daily basis. The thinking is that if we can both identify and understand why stocks are doing what they are doing on a short-term basis; we are not likely to be surprised/blind-sided by a big move. Listed below are what we believe to be the driving forces of the current market (Listed in order of importance).
1. The State of Global Central Bank Policies
2. The State of the Earnings Season
3. The State of Oil Prices
4. The State of U.S. Economic Growth
Thought For The Day:
A volunteer is worth twenty pressed men - English Proverb
Here's wishing you green screens and all the best for a great day,

David D. Moenning
Founder: Heritage Capital Research
Chief Investment Officer: Sowell Management Services
Looking for More on the State of the Markets?
!function(d,s,id){var js,fjs=d.getElementsByTagName(s)[0],p=/^http:/.test(d.location)?'http':'https';if(!d.getElementById(id)){js=d.createElement(s);js.id=id;js.src=p+'://platform.twitter.com/widgets.js';fjs.parentNode.insertBefore(js,fjs);}}(document, 'script', 'twitter-wjs');Disclosures
The opinions and forecasts expressed herein are those of Mr. David Moenning and may not actually come to pass. Mr. Moenning's opinions and viewpoints regarding the future of the markets should not be construed as recommendations. The analysis and information in this report is for informational purposes only. No part of the material presented in this report is intended as an investment recommendation or investment advice. Neither the information nor any opinion expressed constitutes a solicitation to purchase or sell securities or any investment program.
Any investment decisions must in all cases be made by the reader or by his or her investment adviser. Do NOT ever purchase any security without doing sufficient research. There is no guarantee that the investment objectives outlined will actually come to pass. All opinions expressed herein are subject to change without notice. Neither the editor, employees, nor any of their affiliates shall have any liability for any loss sustained by anyone who has relied on the information provided.
The analysis provided is based on both technical and fundamental research and is provided "as is" without warranty of any kind, either expressed or implied. Although the information contained is derived from sources which are believed to be reliable, they cannot be guaranteed.
David D. Moenning is an investment adviser representative of Sowell Management Services, a registered investment advisor. For a complete description of investment risks, fees and services, review the firm brochure (ADV Part 2) which is available by contacting Sowell. Sowell is not registered as a broker-dealer.
Employees and affiliates of Sowell may at times have positions in the securities referred to and may make purchases or sales of these securities while publications are in circulation. Positions may change at any time.
Investments in equities carry an inherent element of risk including the potential for significant loss of principal. Past performance is not an indication of future results.
Advisory services are offered through Sowell Management Services.
Recent free content from FrontRange Trading Co.
-
 Is The Bull Argument Too Easy These Days?
— 8/31/20
Is The Bull Argument Too Easy These Days?
— 8/31/20
-
What Do The Cycles Say About 2020?
— 1/21/20
-
Modeling 2020 Expectations (Just For Fun)
— 1/13/20
-
Tips From Real-World Wendy Rhoades
— 5/06/19
-
The Best Recession Ever!
— 4/29/19
-
{[comment.author.username]} {[comment.author.username]} — Marketfy Staff — Maven — Member


- 1 Campus Martius, Suite #200Detroit, MI 48226
- +1 877 440 9464