

A Good Overbought Condition
Good morning and welcome back. Since I like to start with something positive whenever possible, let me just say that it is a glorious summer morning here in Evergreen, Colorado! It's also a big week for the markets as earnings season moves into high gear, the Republican National Convention kicks off, the ECB will hold its first meeting after the BREXIT, the coup attempt in Turkey was put down, and both the Dow and S&P 500 start the week at or very near record highs.
Since it's Monday, let's move on to our weekly review of the state of the market and our major market indicators/models.
As usual, the first stop is a review of the price/trend of the market. Here's my take...
- As the chart below shows, the S&P 500 clearly broke out of the recent trading range
- The move has been fairly decisive so far
- The S&P 500 has now been above its 5-day moving average for 12 consecutive days - a sign of strength in the short-term
- The bulls have "earned" a rest - cue the test of the breakout area
- S&P 2120 is now key support and the near-term line in the sand
- As long as 2120 holds, the bulls should be given the benefit of any doubt
S&P 500 - Daily 
View Larger Image
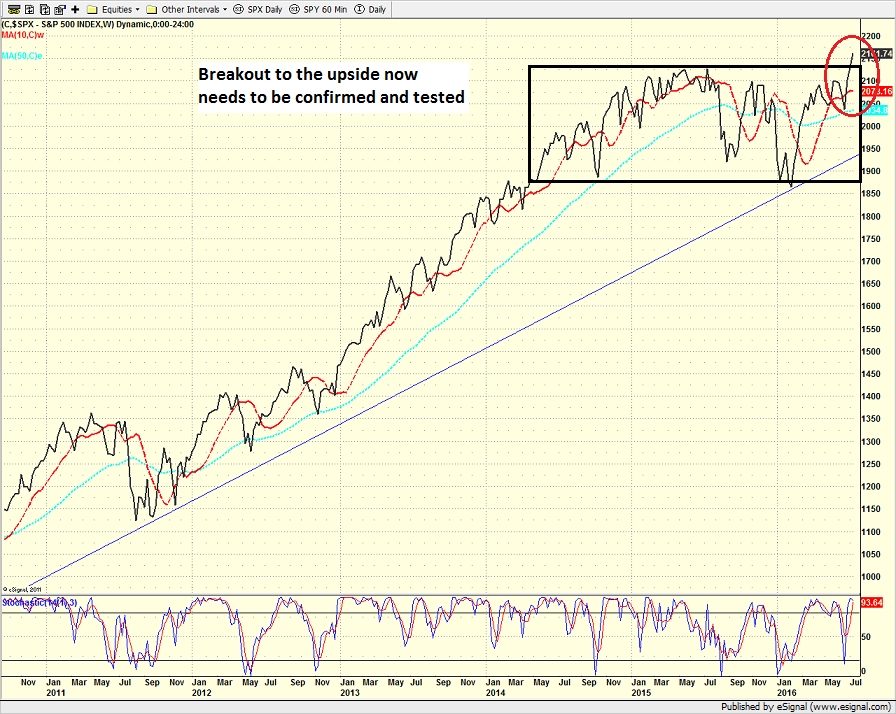
From a longer-term perspective (e.g. looking at a weekly chart of the S&P 500)...
- The bulls were able to produce a breakout on the weekly chart as well
- Breakout will need to be confirmed (requires 2% move above the top end)
- Report from Ned Davis Research shows breakouts to new highs following a cyclical bear market (a) tend to stick and (b) produce above average returns for next 3-, 6, 9- , and 12-months
- Not that an uptrend line can be drawn from the 2009 low on the weekly chart
- Bulls should expect to see the breakout area tested
- The longer the major indices can trade above the breakout areas, the better
S&P 500 - Weekly 
View Larger Image
Here's the view of the "state of the trend" from our indicator panel.

- As expected with market at new highs, there is a lot of green on the trend board
- The only negative is the cycle composite, which points slightly lower this week
- Cycle composite then calls for higher prices into mid-August
- All 3 Trading Mode models continue to call this a mean reverting environment - this needs to improve in the coming weeks in order for the bulls to continue to romp
Next up is the momentum indicator board...

- Positive to see a sea of green on the momentum indicator panel
- Some of our complaints about the lack of internal strength of the market have been removed during the rally
- It is positive to see our Volume Relationship models both green now
- The shorter-term Volume model shows a surge
- All three Thrust models positive
- Advance-Decline Thrust model hit highest level since early 1987
- The only complaint is the Industry Health model remains only moderately positive - but this can change quickly should the rally continue
Next up is the "early warning" board, which is designed to indicate when traders may start to "go the other way" for a trade.

- Stocks are now overbought from both short- and intermediate-term perspectives
- Early Warning board flashing warning signs with a lot of red
- This is when overbought indicators can be tricky to use. During strong moves higher, stocks get overbought and stay overbought - this is a sign of strength. And this is why we rate the current signals as "hold" at the present time.
- For example, look at the historical return for the intermediate-term overbought/sold model. Thus we call this a "good overbought" condition
- The Mean Reversion Model is currently neutral - but for those itching to go the other way, it is close to issuing a sell signal
- VIX gave a sell signal last week. However, note that during strong uptrends, this indicator will give multiple signals.
- Sentiment models now negative - but not overwhelmingly so
Now let's move on to the market's "external factors" - the indicators designed to tell us the state of the big-picture market drivers including monetary conditions, the economy, inflation, and valuations.

- Once again, not much new to report here
- Monetary conditions remain moderately positive
- The Economic model upticked a bit recently
- Subcomponent of the Econ model moved back into "strong growth" mode - suggests no risk of recession
- Inflation Model remains neutral but the trend of the model is up
- Valuations remain a net negative - IF traders decide to focus on this uber-long-term area of analysis
Finally, let's turn to our favorite big-picture market models, which are designed to tell us which team is in control of the prevailing major trend.

- Frankly, I'd like to see a bit more green on this board
- The good news is the Leading Indicators model, which did a very good job of both warning of trouble in May 2015 and then flashing a green light early in the year, remains positive
- The Risk/Reward model, which is designed to indicate the overall "weight of the evidence" needs to improve soon - otherwise a "breakout fake out" could easily occur
- Overall, the combined historical returns remain above average for the panel
The Takeaway...
Stocks have broken out to the upside with strong internal momentum. The indices are overbought, but I will argue that we are currently seeing a "good overbought" condition (time will tell on this score). However, let's keep in mind that all breakouts have been "fake outs" since the end of 2014 and that a healthy dose of skepticism toward both the global and domestic economies remains intact. As such, we should probably expect to see a test of the breakout areas in the near-term. The bulls will be trying to hold the line at 2120ish while the bears will be attempting to produce another "fake out." But when all is said and done, our view is that the indicator board tells us to give the bulls the benefit of any doubt here and to continue to implement a "buy the dips" approach.
Current Market Drivers
We strive to identify the driving forces behind the market action on a daily basis. The thinking is that if we can both identify and understand why stocks are doing what they are doing on a short-term basis; we are not likely to be surprised/blind-sided by a big move. Listed below are what we believe to be the driving forces of the current market (Listed in order of importance).
1. The State of Global Central Bank Policies
2. The State of U.S. Economic Growth
3. The Impact of the "BREXIT"
4. The State of the Stock Market Valuations
Thought For The Day:
"Life can only be understood backwards, but must be lived forwards." -- Soren Kirkegaard
Here's wishing you green screens and all the best for a great day,

David D. Moenning
Founder: Heritage Capital Research
Chief Investment Officer: Sowell Management Services
Looking for More on the State of the Markets?
!function(d,s,id){var js,fjs=d.getElementsByTagName(s)[0],p=/^http:/.test(d.location)?'http':'https';if(!d.getElementById(id)){js=d.createElement(s);js.id=id;js.src=p+'://platform.twitter.com/widgets.js';fjs.parentNode.insertBefore(js,fjs);}}(document, 'script', 'twitter-wjs');Disclosures
The opinions and forecasts expressed herein are those of Mr. David Moenning and may not actually come to pass. Mr. Moenning's opinions and viewpoints regarding the future of the markets should not be construed as recommendations. The analysis and information in this report is for informational purposes only. No part of the material presented in this report is intended as an investment recommendation or investment advice. Neither the information nor any opinion expressed constitutes a solicitation to purchase or sell securities or any investment program.
Any investment decisions must in all cases be made by the reader or by his or her investment adviser. Do NOT ever purchase any security without doing sufficient research. There is no guarantee that the investment objectives outlined will actually come to pass. All opinions expressed herein are subject to change without notice. Neither the editor, employees, nor any of their affiliates shall have any liability for any loss sustained by anyone who has relied on the information provided.
The analysis provided is based on both technical and fundamental research and is provided "as is" without warranty of any kind, either expressed or implied. Although the information contained is derived from sources which are believed to be reliable, they cannot be guaranteed.
David D. Moenning is an investment adviser representative of Sowell Management Services, a registered investment advisor. For a complete description of investment risks, fees and services, review the firm brochure (ADV Part 2) which is available by contacting Sowell. Sowell is not registered as a broker-dealer.
Employees and affiliates of Sowell may at times have positions in the securities referred to and may make purchases or sales of these securities while publications are in circulation. Positions may change at any time.
Investments in equities carry an inherent element of risk including the potential for significant loss of principal. Past performance is not an indication of future results.
Advisory services are offered through Sowell Management Services.
Recent free content from FrontRange Trading Co.
-
 Is The Bull Argument Too Easy These Days?
— 8/31/20
Is The Bull Argument Too Easy These Days?
— 8/31/20
-
What Do The Cycles Say About 2020?
— 1/21/20
-
Modeling 2020 Expectations (Just For Fun)
— 1/13/20
-
Tips From Real-World Wendy Rhoades
— 5/06/19
-
The Best Recession Ever!
— 4/29/19
-
{[comment.author.username]} {[comment.author.username]} — Marketfy Staff — Maven — Member


- 1 Campus Martius, Suite #200Detroit, MI 48226
- +1 877 440 9464