

Is a Breakout In the Cards?
Good morning and welcome back. Friday's Jobs report provided traders with confirmation that the U.S. economy is not falling off a cliff and that May's nonfarm payroll data was a one-off. Even without the 170,000 striking Verizon workers returning to work (which artificially inflated the data) the total number of new jobs created in June was the best of the year. Thus, traders pushed the S&P 500 back to within a whisker of an all-time high. The question, of course, is if the venerable index can (a) actually make a new high and (b) keep it for more than a few days.
Since it's Monday, let's move on to our weekly review of the state of the market and our major market indicators/models.
As usual, the first stop is a review of the price/trend of the market. Here's my take...
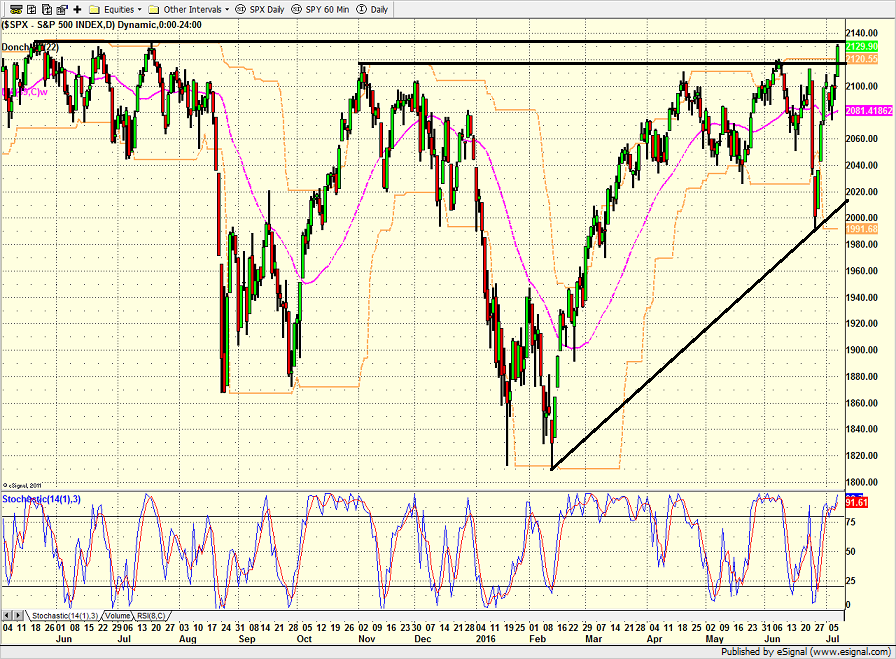
- Friday's move was a breakout of the most recent trading range
- The S&P 500 finished less than a point from the 5.21.15 all-time high of 2130.82
- The S&P 500 is also pushing its intraday high-water mark of 2134.28
- S&P 500 2120 now becomes important support from a short-term perspective
- Unfortunately, the S&P 500 has spent just 3 consecutive days on average above 2100 this year
- Since there are likely plenty of fast-money types looking to "fade" the breakout, we should expect to see a test of support
S&P 500 - Daily 
View Larger Image
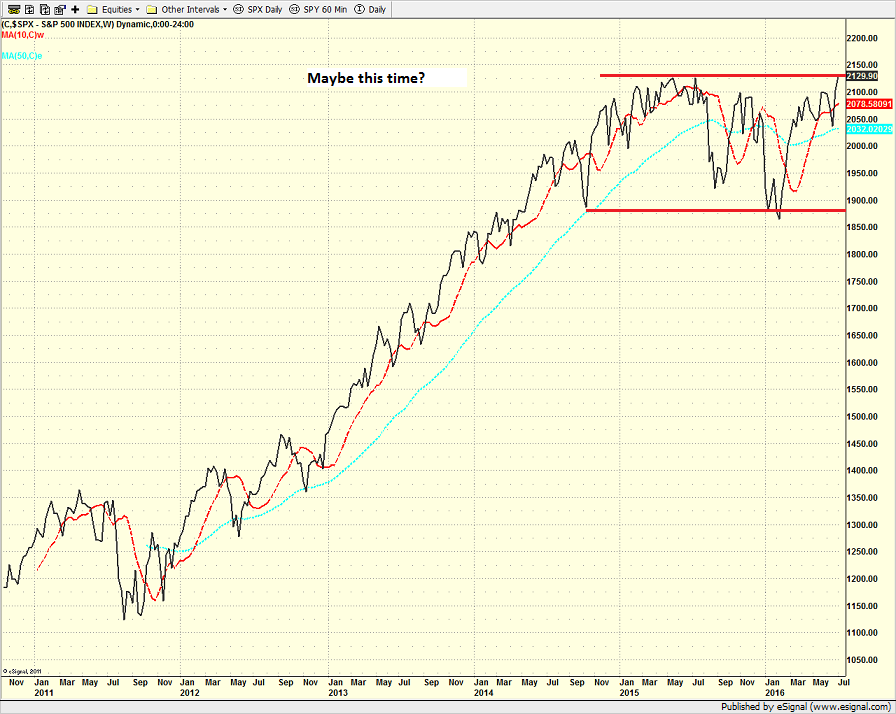
From a longer-term perspective (e.g. looking at a weekly chart of the S&P 500)...
- The S&P 500 set a new all-time closing high on a weekly chart - by just a smidge
- Thus, as the chart shows, there is no break of the range that has been in place since late 2014
- We would need to see a confirmed/sustained break above 2130 on a weekly chart to contend that a new uptrend has begun
S&P 500 - Weekly 
View Larger Image
Here's the view of the "state of the trend" from our indicator panel.

- As expected, there is a lot of green on the Price Indicator board
- The cycle composite is neutral for the coming week, is down slightly for the next week, but then points higher into mid-August
- All 3 of our indicators still call this a mean-reverting environment (i.e. not a trending market)
- Both the channel breakout systems are now positive
Next up is the momentum indicator board...

- The short-term Trend & Breadth confirm model is now positive. From 1980, the S&P 500 has risen at an average annualized rate of 30%.
- However, since 2009, when the S.T. T&B confirm model has been positive, the S&P 500 has actually lost ground at an annualized rate of -2.4%
- This is likely due to all of the reversals, V-bottoms, and choppy trading ranges that have become the normal trading mode
- The Industry Health Model remains only moderately positive. I'd like to see this positive to get more excited about the bull case.
- Both Volume Relationship models are positive - albeit only mildly so
- Thrust indicators also only moderately positive at best
- Again, I'd like to see more "oomph" from these indicators
Next up is the "early warning" board, which is designed to indicate when traders may start to "go the other way" for a trade.

- That's a lot of yellow... Can you say, "neutral?"
- Stocks are overbought from a short-term perspective but neutral from an intermediate-term view
- Since stocks are not yet overbought from I.T. perspective, bulls have an opening
- Our Mean Reversion model issued a sell signal on Friday
- The VIX is crashing and is close to issuing a sell signal - but has not done so yet
- Sentiment Models are all neutral - also suggests bulls may have some room to run
Now let's move on to the market's "external factors" - the indicators designed to tell us the state of the big-picture market drivers including monetary conditions, the economy, inflation, and valuations.

- With interest rates remaining at record lows, there has been some improvement in the monetary indicators
- The Inflation model is still neutral, but the trend of the indicator is sloping higher
- The component inflation model is very close to the "moderate inflation" zone
Finally, let's turn to our favorite big-picture market models, which are designed to tell us which team is in control of the prevailing major trend.

- There has been no real change in our Primary Cycle models
- The return projection is in line with the S&P's historical norm
The Takeaway...
The S&P 500 and DJIA are close to making new all-time highs. However, given that all breakout attempts have failed since late 2014, the 2135 area on the S&P 500 represents stiff resistance as well as a tempting short opportunity for traders. The good news is that economic conditions in the U.S. are showing signs of improvement and that the economy has grown at a faster rate in the second half of the year for several years running. As such, we remain cautiously optimistic from a longer-term standpoint but are holding our breath from a short-term point of view.
Current Market Drivers
We strive to identify the driving forces behind the market action on a daily basis. The thinking is that if we can both identify and understand why stocks are doing what they are doing on a short-term basis; we are not likely to be surprised/blind-sided by a big move. Listed below are what we believe to be the driving forces of the current market (Listed in order of importance).
1. The State of Global Central Bank Policies
2. The State of U.S. Economic Growth
3. The Impact of the "BREXIT"
4. The State of the Stock Market Valuations
Thought For The Day:
Life is really simple, but we insist on making it complicated. -Confucius
Here's wishing you green screens and all the best for a great day,

David D. Moenning
Founder: Heritage Capital Research
Chief Investment Officer: Sowell Management Services
Looking for More on the State of the Markets?
!function(d,s,id){var js,fjs=d.getElementsByTagName(s)[0],p=/^http:/.test(d.location)?'http':'https';if(!d.getElementById(id)){js=d.createElement(s);js.id=id;js.src=p+'://platform.twitter.com/widgets.js';fjs.parentNode.insertBefore(js,fjs);}}(document, 'script', 'twitter-wjs');Disclosures
The opinions and forecasts expressed herein are those of Mr. David Moenning and may not actually come to pass. Mr. Moenning's opinions and viewpoints regarding the future of the markets should not be construed as recommendations. The analysis and information in this report is for informational purposes only. No part of the material presented in this report is intended as an investment recommendation or investment advice. Neither the information nor any opinion expressed constitutes a solicitation to purchase or sell securities or any investment program.
Any investment decisions must in all cases be made by the reader or by his or her investment adviser. Do NOT ever purchase any security without doing sufficient research. There is no guarantee that the investment objectives outlined will actually come to pass. All opinions expressed herein are subject to change without notice. Neither the editor, employees, nor any of their affiliates shall have any liability for any loss sustained by anyone who has relied on the information provided.
The analysis provided is based on both technical and fundamental research and is provided "as is" without warranty of any kind, either expressed or implied. Although the information contained is derived from sources which are believed to be reliable, they cannot be guaranteed.
David D. Moenning is an investment adviser representative of Sowell Management Services, a registered investment advisor. For a complete description of investment risks, fees and services, review the firm brochure (ADV Part 2) which is available by contacting Sowell. Sowell is not registered as a broker-dealer.
Employees and affiliates of Sowell may at times have positions in the securities referred to and may make purchases or sales of these securities while publications are in circulation. Positions may change at any time.
Investments in equities carry an inherent element of risk including the potential for significant loss of principal. Past performance is not an indication of future results.
Advisory services are offered through Sowell Management Services.
Recent free content from FrontRange Trading Co.
-
 Is The Bull Argument Too Easy These Days?
— 8/31/20
Is The Bull Argument Too Easy These Days?
— 8/31/20
-
What Do The Cycles Say About 2020?
— 1/21/20
-
Modeling 2020 Expectations (Just For Fun)
— 1/13/20
-
Tips From Real-World Wendy Rhoades
— 5/06/19
-
The Best Recession Ever!
— 4/29/19
-
{[comment.author.username]} {[comment.author.username]} — Marketfy Staff — Maven — Member


- 1 Campus Martius, Suite #200Detroit, MI 48226
- +1 877 440 9464