

The Current Strategy Is To...
Good morning and welcome back. I've got a busy week ahead with two trips to the airport on the calendar, so let's not waste any time and jump right in to our objective review of the state of the market and our major market indicators/models.
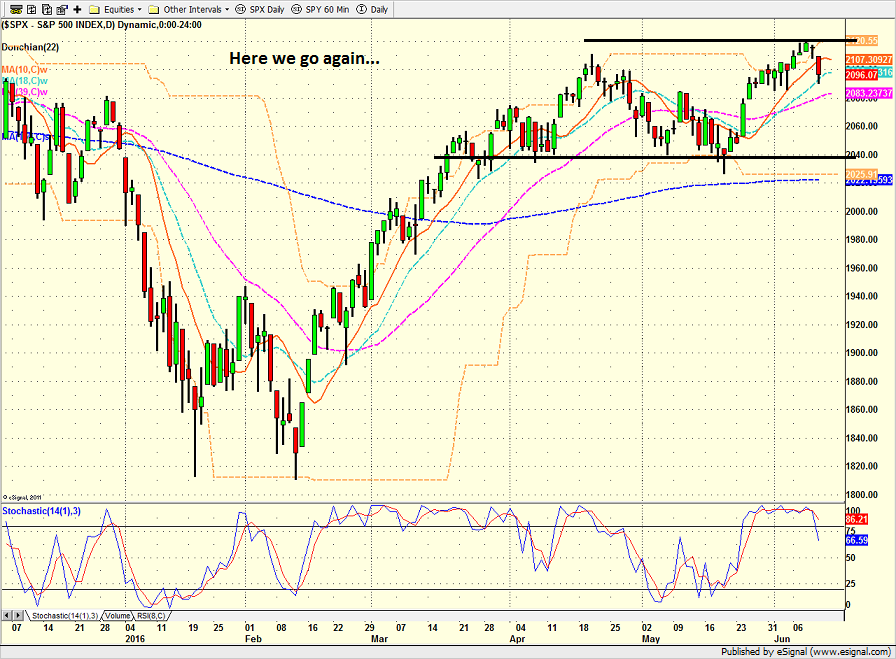
As usual, the first stop is a review of the price/trend of the market. Here's my take...
- After an all-too brief break above 2100, it appears that the "breakout fake-out" is back in play. So what else is new, right?
- There appear to be two "worries" (a term I use lightly these days) in the market these days:
- The "big, bad events" that lay ahead (FOMC meeting and the Brexit)
- The concern over rates, oil, commodities and global growth
- And after this weekend, we can add terrorism to the list. Our hearts go out to the people of Orlando and the LGBT community.
- So, from a short-term perspective, the situation is simple: Here we go again.
- The first level of resistance is 2080 and then 2040.
- We'd look for a run-of-the-mill 3%(ish) pullback
S&P 500 - Daily 
View Larger Image
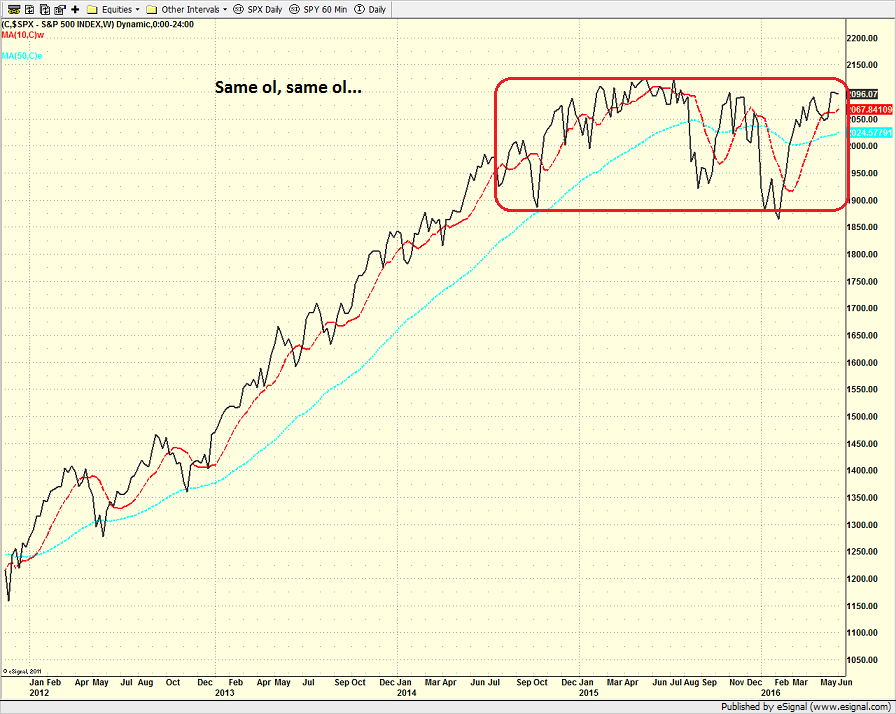
From a longer-term perspective (e.g. looking at a weekly chart of the S&P 500)...
- The near-term pullback doesn't change the longer-term picture at all.
- While I should leave this bullet point permanently on the list: The song remains the same - the long-term, sideways range continues.
- A break below 2050 on the weekly chart would embolden definitely the bears.
- The next support on the weekly chart is 2000
- However, note that the 200-day MA is at 2015 and the 150-day MA is at 2022. Why do we care, you ask? Actually, we don't. But these are he moving averages the press and the so-called experts focus on.
- Get ready to buy the dip. No, seriously.
S&P 500 - Weekly 
View Larger Image
Here's the view of the "state of the trend" from our indicator panel.

- The good news is that pullbacks haven't produced much pain of late.
- The bad news is the board is now neutral at best.
- The good news is our cycle composite continues to suggest higher prices into mid-July.
- Should the market continue to decline, we will note that our channel breakout systems triggered a timely sell.
- Our trending vs. mean reverting models also did a good job of telling us that the "breakout" was suspect.
- I'd get ready to buy the dip. Oh wait, did I suggest that already?
Next up is the momentum indicator board...

- The momentum board is neutral to moderately positive. But I'd lean more toward the neutral side here.
- The trend & breadth confirm models are split - as expected.
- The industry health model upticked to moderately positive this week. However, it did so by the skinniest of margins.
- The volume relationship models are also split. However, we note that both have been in uninspired modes for some time now.
- The thrust models are suggesting that momentum has waned.
- However, the current historical return of the board remains above average.
- As such, buying the dip would be the best strategy. Oops... did I...
Next up is the "early warning" board, which is designed to indicate when traders may start to "go the other way" for a trade.

- The message from the early warning board is clear - there isn't a green box to be found.
- Stocks had become overbought.
- Sentiment had become positive.
- The VIX indicator gave what appears to be a timely warning signal.
- This board is an example of "mean reversion" work at its finest. The goal is to be the most bullish at the bottom of declines and the most bearish at during extended advances.
- My personal mean reversion model went negative on Thursday. Not bad.
- So, the plan is to...
Now let's move on to the market's "external factors" - the indicators designed to tell us the state of the big-picture market drivers including monetary conditions, the economy, inflation, and valuations.

As a reminder, this board doesn't change very often.
- And yet, there are changes this week as our absolute monetary model flipped to neutral. And since 2007, the average return when this model is neutral isn't good: -3.7%.
- When you combine the average historical returns of the two monetary models, you come up with +0.45%.
- The takeaway here is that the monetary tailwinds in the U.S. have definitely stopped blowing.
- However, the ECB and the BOJ continue to print money and "but stuff" like it's going out of style - producing negative interest rates in a BUNCH of places.
- The macro thinkers suggest this won't end well.
- But then again, the macro crowd hasn't had much to crow about since 2008.
- The overall average historical return for this board is now just +2.1% per year. Obviously this is well below average.
Finally, let's turn to our favorite big-picture market models, which are designed to tell us which team is in control of the prevailing major trend.

- Our leading indicators model, which did a great job of calling the weakness and then returning to a positive mode after the January/February swoon, has pulled back a bit. But the models remain well into positive territory.
- The state of the tape model is now positive, but as I mentioned above, by only the slimmest of margins.
- The risk/reward model remains neutral. And in looking back, this model has done a stellar job of calling the overall environment.
- The external factors model has also pulled back (due to the weakening monetary conditions).
- The overall rating remains moderately positive.
- The historical rating sits at a nice, round 10%, which is about the historical average for the U.S. stock market.
The Takeaway...
Stocks reversed the April/May pullback with a May/June rally. But unfortunately, the rally's momentum has waned in front of the big, bad events (and the weakness in the economic picture). So, it isn't terribly surprising to see stocks begin to pull back.
The good news is our cycle composite suggests that the current rally has a way to go yet and there aren't any glaring problems on the indicator boards. In fact, the models suggest that stocks are biding their time, waiting for the uncertainty to clear. The question, of course, is when and if this will happen.
So, the bottom line is we expect any pullbacks in the near-term to be shallow. And since we continue to believe that U.S. stocks remain in a secular bull market, the appropriate response is to... wait for it... buy the dips!
Current Market Drivers
We strive to identify the driving forces behind the market action on a daily basis. The thinking is that if we can both identify and understand why stocks are doing what they are doing on a short-term basis; we are not likely to be surprised/blind-sided by a big move. Listed below are what we believe to be the driving forces of the current market (Listed in order of importance).
1. The State of Fed Policy
2. The State of U.S. Economic Growth
3. The State of Global Economic Growth
4. The State of the Stock Market Valuations
Thought For The Day:
Be kind to unkind people - they need it the most. - Unknown
Here's wishing you green screens and all the best for a great day,

David D. Moenning
Founder: Heritage Capital Research
Chief Investment Officer: Sowell Management Services
Looking for More on the State of the Markets?
!function(d,s,id){var js,fjs=d.getElementsByTagName(s)[0],p=/^http:/.test(d.location)?'http':'https';if(!d.getElementById(id)){js=d.createElement(s);js.id=id;js.src=p+'://platform.twitter.com/widgets.js';fjs.parentNode.insertBefore(js,fjs);}}(document, 'script', 'twitter-wjs');Disclosures
The opinions and forecasts expressed herein are those of Mr. David Moenning and may not actually come to pass. Mr. Moenning's opinions and viewpoints regarding the future of the markets should not be construed as recommendations. The analysis and information in this report is for informational purposes only. No part of the material presented in this report is intended as an investment recommendation or investment advice. Neither the information nor any opinion expressed constitutes a solicitation to purchase or sell securities or any investment program.
Any investment decisions must in all cases be made by the reader or by his or her investment adviser. Do NOT ever purchase any security without doing sufficient research. There is no guarantee that the investment objectives outlined will actually come to pass. All opinions expressed herein are subject to change without notice. Neither the editor, employees, nor any of their affiliates shall have any liability for any loss sustained by anyone who has relied on the information provided.
The analysis provided is based on both technical and fundamental research and is provided "as is" without warranty of any kind, either expressed or implied. Although the information contained is derived from sources which are believed to be reliable, they cannot be guaranteed.
David D. Moenning is an investment adviser representative of Sowell Management Services, a registered investment advisor. For a complete description of investment risks, fees and services, review the firm brochure (ADV Part 2) which is available by contacting Sowell. Sowell is not registered as a broker-dealer.
Employees and affiliates of Sowell may at times have positions in the securities referred to and may make purchases or sales of these securities while publications are in circulation. Positions may change at any time.
Investments in equities carry an inherent element of risk including the potential for significant loss of principal. Past performance is not an indication of future results.
Advisory services are offered through Sowell Management Services.
Recent free content from FrontRange Trading Co.
-
 Is The Bull Argument Too Easy These Days?
— 8/31/20
Is The Bull Argument Too Easy These Days?
— 8/31/20
-
What Do The Cycles Say About 2020?
— 1/21/20
-
Modeling 2020 Expectations (Just For Fun)
— 1/13/20
-
Tips From Real-World Wendy Rhoades
— 5/06/19
-
The Best Recession Ever!
— 4/29/19
-
{[comment.author.username]} {[comment.author.username]} — Marketfy Staff — Maven — Member


- 1 Campus Martius, Suite #200Detroit, MI 48226
- +1 877 440 9464