

The Evidence Suggests...
Good morning and Happy Monday. Although my life has been a blur lately, my calendar tells me it's time to perform an objective review of the state of the market and our major market indicators/models.
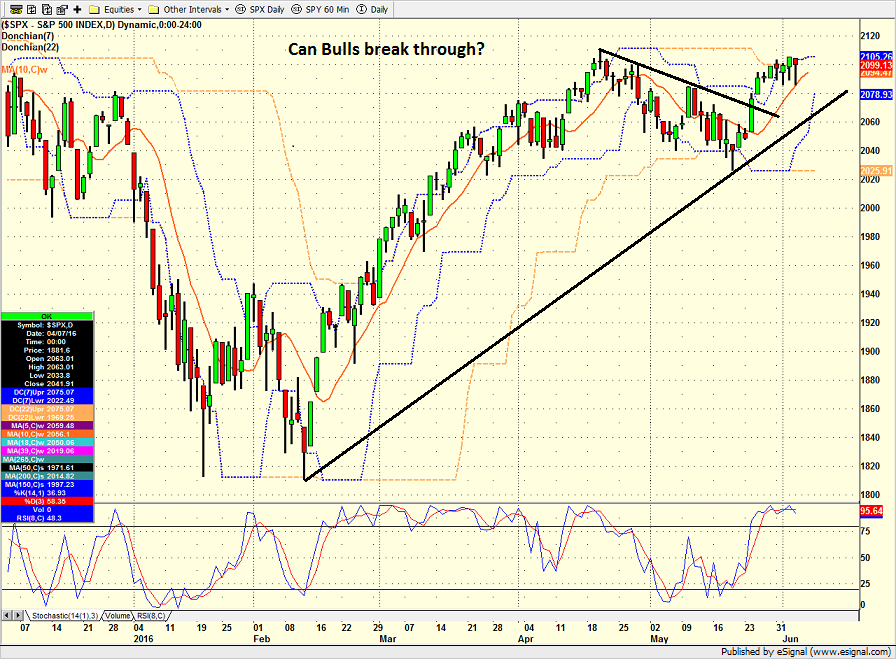
As usual, the first stop is a review of the price/trend of the market. Here's my take...
- Two weeks ago, the short-term trend was down - now it's up. Such is the way the game is played these days.
- The potential Cup-with-Handle formation was resolved to the upside. This would suggest more gains ahead.
- The bad news is the rally appears to be waning at this time.
- The good news is the bears were unable to do anything with their opportunities last week. This suggests an upward bias remains in place.
- Every chart watcher on the planet is now yammering on about a potential double-top. As such, beware of self-fulfilling prophecies.
- Under the Captain Obvious category: A meaningful/lasting break above last week's high would likely lead to a test of all-time highs.
- And a break below 2040 would embolden bear camp.
S&P 500 - Daily 
View Larger Image
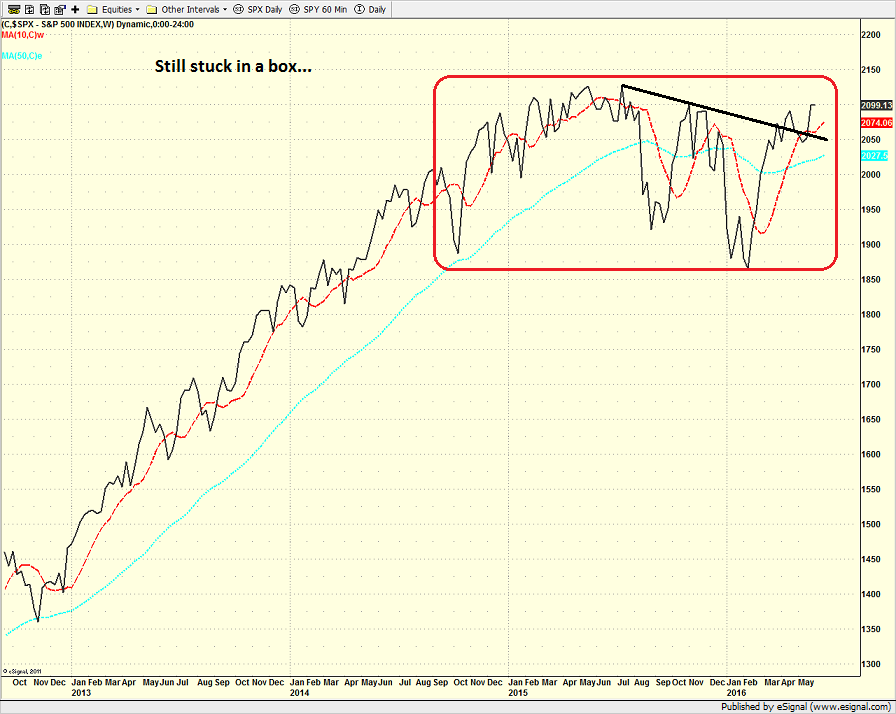
From a longer-term perspective (e.g. looking at a weekly chart of the S&P 500)...
- And we're back... into resistance, that is.
- The longer-term downtrend line has been broken.
- But, the indices remain stuck in a sideways consolidation phase.
- To review, note that market usually resolves this type of patter to the upside.
S&P 500 - Weekly 
View Larger Image
Here's the view of the "state of the trend" from our indicator panel.

- As expected, this panel is now largely positive.
- The red boxes are "barely red" as the channel breakout system gave a sell signal by the slimmest of margins on Friday - and a close over 2106 would flip both indicators back to positive.
- The cycle composite remains positive for the next several weeks. However, the cycles point to weakness early in the week.
- Two of our three "trading mode" models continue to call this a mean reverting environment. Thus, one should wait for confirmation of a breakout before adding to long positions.
Next up is the momentum indicator board...

- There is a lot of green on this board.
- Both of our Trend & Breadth Confirmation models are positive at this time.
- All of our "Thrust" indicators are positive.
- Both of our Volume Relationship models are positive (well, moderately positive).
- However, the Industry Health Model has weakened recently. Bottom Line: This is NOT a desired result at this time!
- Therefore, I will contend that the market is not nearly as strong as this board might lead one to believe.
Next up is the "early warning" board, which is designed to indicate when traders may start to "go the other way" for a trade.

- Stocks are now overbought from both short- and intermediate-term perspective (more so on the short-term).
- Our Mean Reversion Models are not yet ready to trigger an "It's time to go the other way" signal.
- Our VIX Model did give a sell signal last week. However, these can be very early and there can be multiple sell signals given before stocks decline.
- Our Sentiment models are coming off positive readings and are no longer a tailwind for the bulls. However, sentiment is not exuberant enough to favor the bears here either.
Now let's move on to the market's "external factors" - the indicators designed to tell us the state of the big-picture market drivers including monetary conditions, the economy, inflation, and valuations.

As a reminder, this board doesn't change very often.
- The two Monetary Models really tell the story here. The Absolute Model suggests that the Fed is still friendly and that rates are low, which has historically been good for stocks. However, the Relative Monetary Model is neutral, suggesting that Friday's big dive in rates aside, the rate environment is not great. I'll also note that the historical returns of both monetary models is below the historical average of about 10% per year.
- One of the internal components of our Economic Model is back into the positive/strong growth mode. We'll see if this holds in the coming weeks.
- The Inflation Model continues to indicate that there is some inflation percolating in the economy.
- The Valuation Models basically cancel each other out and suggest a lower-than average return for stocks in this environment.
Finally, let's turn to our favorite big-picture market models, which are designed to tell us which team is in control of the prevailing major trend.

- The Leading Indicators Model remains positive. This is perhaps the most upbeat indicator on the board right now as the model has done a very good job at calling the market's major moves in the past few years.
- The State of the Tape Model (aka my "Desert Island" indicator) has weakened. And this is perhaps the most worrisome indicator on the board.
- In addition, the Risk/Reward model refuses to leave the neutral zone for any length of time. IMO, this is probably the best "tell" as to the state of the overall market environment here.
- The External Factors Model has been moving lower recently and is now only in the moderately positive mode. This too is concerning from a big picture standpoint as this model hasn't been negative since 2010.
The Takeaway...
Usually one only needs to look at the overall color of the various indicator panels in order to get a feel for the overall "weight of the evidence." However, currently such an approach might produce an overly optimistic view - especially after Friday's Jobs Report.
In short, for every positive there is a corresponding "yea, but" that can be applied. And with prices near all-time highs, it is hard to see what could trigger a round of enthusiastic buying. Therefore, the overall environment is likely closer to neutral than positive at this stage.
My plan at this point is to wait for the bulls to "show me something real" before getting overly excited about a new leg higher in stocks. However, from a longer-term standpoint, I do think that the indicators tell us to give the bulls the benefit of the doubt and to "buy the dips" - which has actually been the best approach of any during this very long and very old bull market.
And on that note, I'm currently working on a systematized, long-term #BTD strategy, which may just be the best investing idea I've ever had :-)
Current Market Drivers
We strive to identify the driving forces behind the market action on a daily basis. The thinking is that if we can both identify and understand why stocks are doing what they are doing on a short-term basis; we are not likely to be surprised/blind-sided by a big move. Listed below are what we believe to be the driving forces of the current market (Listed in order of importance).
1. The State of U.S. Economic Growth
2. The State of Fed Policy
3. The State of Global Economic Growth
4. The State of the Stock Market Valuations
Thought For The Day:
"Imagination was given to man to compensate him for what he is not, and a sense of humor was provided to console him for what he is." - Oscar Wilde
Here's wishing you green screens and all the best for a great day,

David D. Moenning
Founder: Heritage Capital Research
Chief Investment Officer: Sowell Management Services
Looking for More on the State of the Markets?
!function(d,s,id){var js,fjs=d.getElementsByTagName(s)[0],p=/^http:/.test(d.location)?'http':'https';if(!d.getElementById(id)){js=d.createElement(s);js.id=id;js.src=p+'://platform.twitter.com/widgets.js';fjs.parentNode.insertBefore(js,fjs);}}(document, 'script', 'twitter-wjs');Disclosures
The opinions and forecasts expressed herein are those of Mr. David Moenning and may not actually come to pass. Mr. Moenning's opinions and viewpoints regarding the future of the markets should not be construed as recommendations. The analysis and information in this report is for informational purposes only. No part of the material presented in this report is intended as an investment recommendation or investment advice. Neither the information nor any opinion expressed constitutes a solicitation to purchase or sell securities or any investment program.
Any investment decisions must in all cases be made by the reader or by his or her investment adviser. Do NOT ever purchase any security without doing sufficient research. There is no guarantee that the investment objectives outlined will actually come to pass. All opinions expressed herein are subject to change without notice. Neither the editor, employees, nor any of their affiliates shall have any liability for any loss sustained by anyone who has relied on the information provided.
The analysis provided is based on both technical and fundamental research and is provided "as is" without warranty of any kind, either expressed or implied. Although the information contained is derived from sources which are believed to be reliable, they cannot be guaranteed.
David D. Moenning is an investment adviser representative of Sowell Management Services, a registered investment advisor. For a complete description of investment risks, fees and services, review the firm brochure (ADV Part 2) which is available by contacting Sowell. Sowell is not registered as a broker-dealer.
Employees and affiliates of Sowell may at times have positions in the securities referred to and may make purchases or sales of these securities while publications are in circulation. Positions may change at any time.
Investments in equities carry an inherent element of risk including the potential for significant loss of principal. Past performance is not an indication of future results.
Advisory services are offered through Sowell Management Services.
Recent free content from FrontRange Trading Co.
-
 Is The Bull Argument Too Easy These Days?
— 8/31/20
Is The Bull Argument Too Easy These Days?
— 8/31/20
-
What Do The Cycles Say About 2020?
— 1/21/20
-
Modeling 2020 Expectations (Just For Fun)
— 1/13/20
-
Tips From Real-World Wendy Rhoades
— 5/06/19
-
The Best Recession Ever!
— 4/29/19
-
{[comment.author.username]} {[comment.author.username]} — Marketfy Staff — Maven — Member


- 1 Campus Martius, Suite #200Detroit, MI 48226
- +1 877 440 9464