

Some Weakness Creeping In...
Modern times demand modern thinking in portfolio design. Learn more...
Good morning and Happy Monday! Since my weekly review of the major indicators tends to get a bit lengthy, I've decided to try and shorten it up a bit by bullet-pointing the key observations in each indicator category. Hopefully this will allow readers to get the important stuff in a more expedient manner.
As usual, the first stop is a review of the price/trend of the market.
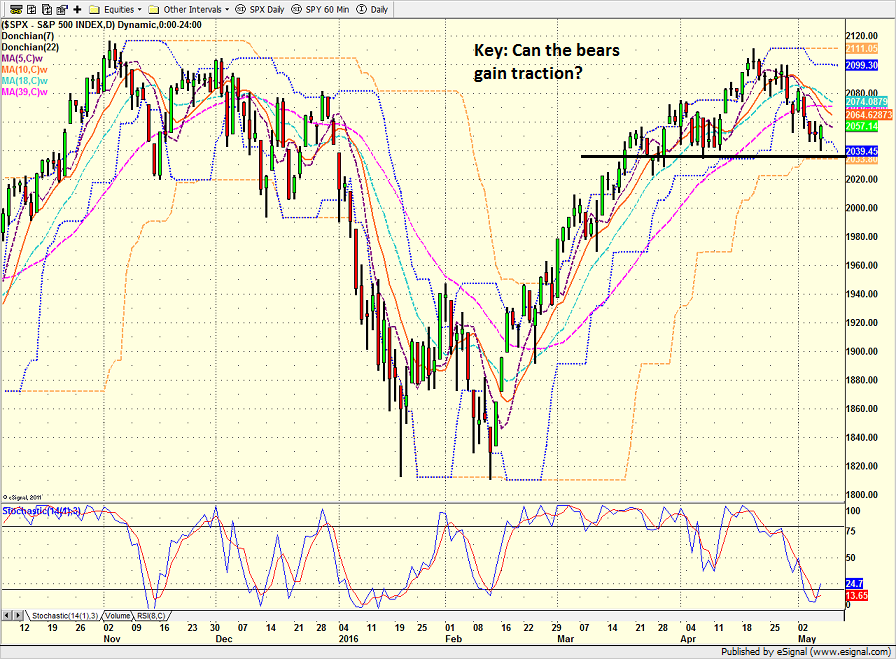
- The short-term trend is down
- Near-term support in the 2020-2040 range remains intact
- Looks like the obligatory "sell in May" action
- Not much conviction from bear camp
- No real catalyst for selling at this time
In sum, the question of the day is if the bears will find a reason to be and produce a break of the key line in the sand. If (key word) our furry friends can gain some traction, I would expect to see a "whoosh" lower. However, so far at least, the selling has been very orderly and not very intense.
S&P 500 - Daily 
View Larger Image
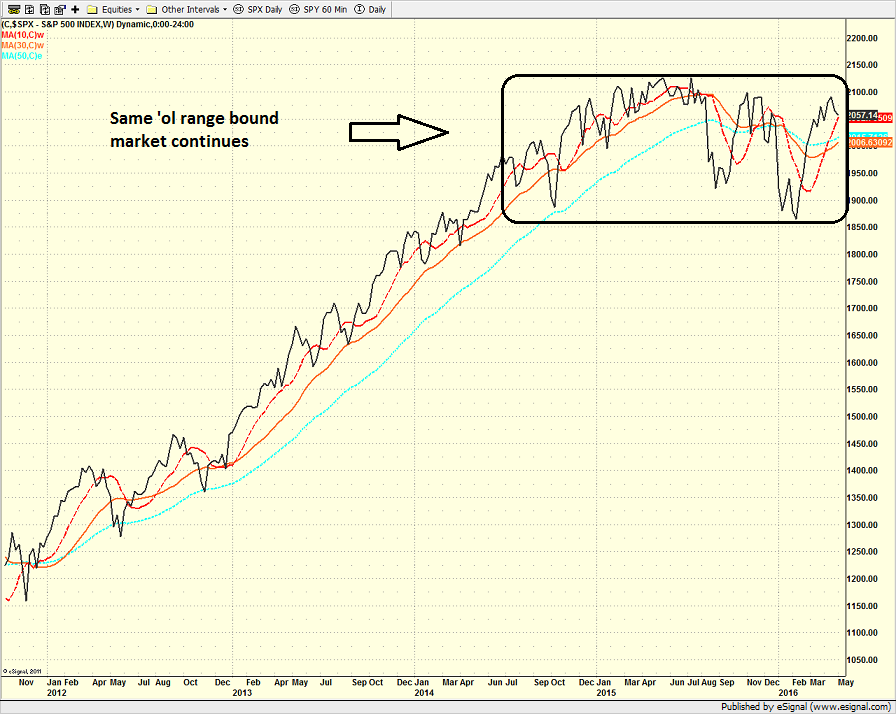
From a longer-term perspective (e.g. the weekly chart of the S&P 500)...
- The song remains the same
- The range bound market that has been in place for more than a year continues
- Current range is about 15% wide
- Action appears to be a consolidation pattern
- Breakout to upside remains most likely outcome
- Bulls will need a catalyst in order to break on through to the other side
S&P 500 - Weekly 
View Larger Image
Now it's time to cease with the subjective analysis of the price action and turn our attention to our objective panel of indicators...

- We rate the short-term trend somewhere between low neutral and moderately negative
- There has been enough weakness to put the state of the intermediate-term trend in question
- The cycle composite agrees with the "Sell in May" strategy for the next two weeks
- Cycles then turn higher for the traditional summer rally once selling subsides
- Trading environment continues to be "mean reversion"
Next up is the momentum indicator board...

- Short-term trend and breadth model has flipped to negative
- But, the intermediate-term model is still positive
- The industry health model (my "Desert Island" model) is holding up nicely
- The volume relationship models are both negative, which is telling/worrisome
- The price thrust model has weakened to neutral
- The breadth thrust model has joined the volume thrust model in negative territory
- The overall historical return for this environment is now slightly negative
Next up is the "early warning" board, which is designed to indicate when traders may start to "go the other way" for a trade.

- Short-term, the market is now oversold
- Intermediate-term, the market is now reversing from a severe overbought condition
- The intermediate-term overbought reading is the type that only occurs a couple/three times a year
- The VIX is in no-man's land and not helpful at this stage
- Sentiment is basically neutral but the short-term model is close to reaching pessimistic levels
- The fact that the longer-term sentiment models reached extreme levels and are now reversing is positive
Now let's move on to the market's "external factors" - the indicators designed to tell us the state of the big-picture market drivers including monetary conditions, the economy, inflation, and valuations.

As a reminder, this board doesn't change very often.
- Only slight changes at the margin here
- The economic model reading hasn't budged but the internal component is showing some weakness
- Valuations remain elevated as GAAP P/E is higher than at any point prior to 1990 except mid-1930's
- With rates at generational lows (and negative in many places), valuations do not appear to be a problem at this time
Finally, let's turn to our favorite big-picture market models, which are designed to tell us which team is in control of the prevailing major trend.

- Leading indicators model still strong at 90% (remember, this model did a wonderful job of signaling trouble last May)
- The risk/reward model downticked back to neutral but historical return is still decent
- The State of the Tape model isn't as strong as it should be if we expect bulls to make a big run
- The external factors board remains strong
- The overall average return when the indicators are in this mode is well above the mean
The Takeaway...
To sum up, I believe the "weight of the evidence" continues to favor the bulls. However, stocks are currently seeing a short-term pullback that as of yet does not contain any real downside momentum. Next, the cycles say we should remain cautious for the next two weeks and then expect a summer rally to take hold. The market is oversold but not to a "screaming buy" level. On the valuation front, there is no question that traditional measures are at extreme levels. Yet when the level of interest rates are taken into account, it's a different picture. And remember, in this business, things like valuations don't matter until they do - and that's when they matter a lot.
The bottom line: I'd continue to give the bulls the benefit of doubt and buy the dips.
Current Market Drivers
We strive to identify the driving forces behind the market action on a daily basis. The thinking is that if we can both identify and understand why stocks are doing what they are doing on a short-term basis; we are not likely to be surprised/blind-sided by a big move. Listed below are what we believe to be the driving forces of the current market (Listed in order of importance).
1. The State of Global Central Bank Policy
2. The State of Global Growth
3. The State of the Stock Market Valuations
4. The State of the Oil Crisis
Today's Pre-Game Indicators
Here are the Pre-Market indicators we review each morning before the opening bell...
Major Foreign Markets:
Japan: Closed
Hong Kong: -0.34%
Shanghai: +0.22%
London: +0.07%
Germany: +0.11%
France: -0.02%
Italy: +0.65%
Spain: +0.96%
Crude Oil Futures: +$1.37 to $45.15
Gold: +7.80 at $1282.20
Dollar: lower against the yen and pound, higher vs. euro
US 10-Year Bond Yield: Currently trading at 1.803%
German 10-Year Bund Yield: Currently trading at 0.202%
Stock Indices in U.S. (relative to fair value):
S&P 500: +8.80
Dow Jones Industrial Average: +65
NASDAQ Composite: +20.25
Thought For The Day:
"Success consists of going from failure to failure without loss of enthusiasm." -Winston Churchill
Here's wishing you green screens and all the best for a great day,

David D. Moenning
Founder: Heritage Capital Research
Chief Investment Officer: Sowell Management Services
Looking for More on the State of the Markets?
!function(d,s,id){var js,fjs=d.getElementsByTagName(s)[0],p=/^http:/.test(d.location)?'http':'https';if(!d.getElementById(id)){js=d.createElement(s);js.id=id;js.src=p+'://platform.twitter.com/widgets.js';fjs.parentNode.insertBefore(js,fjs);}}(document, 'script', 'twitter-wjs');Disclosures
The opinions and forecasts expressed herein are those of Mr. David Moenning and may not actually come to pass. Mr. Moenning's opinions and viewpoints regarding the future of the markets should not be construed as recommendations. The analysis and information in this report is for informational purposes only. No part of the material presented in this report is intended as an investment recommendation or investment advice. Neither the information nor any opinion expressed constitutes a solicitation to purchase or sell securities or any investment program.
Any investment decisions must in all cases be made by the reader or by his or her investment adviser. Do NOT ever purchase any security without doing sufficient research. There is no guarantee that the investment objectives outlined will actually come to pass. All opinions expressed herein are subject to change without notice. Neither the editor, employees, nor any of their affiliates shall have any liability for any loss sustained by anyone who has relied on the information provided.
The analysis provided is based on both technical and fundamental research and is provided "as is" without warranty of any kind, either expressed or implied. Although the information contained is derived from sources which are believed to be reliable, they cannot be guaranteed.
David D. Moenning is an investment adviser representative of Sowell Management Services, a registered investment advisor. For a complete description of investment risks, fees and services, review the firm brochure (ADV Part 2) which is available by contacting Sowell. Sowell is not registered as a broker-dealer.
Employees and affiliates of Sowell may at times have positions in the securities referred to and may make purchases or sales of these securities while publications are in circulation. Positions may change at any time.
Investments in equities carry an inherent element of risk including the potential for significant loss of principal. Past performance is not an indication of future results.
Advisory services are offered through Sowell Management Services.
Recent free content from FrontRange Trading Co.
-
 Is The Bull Argument Too Easy These Days?
— 8/31/20
Is The Bull Argument Too Easy These Days?
— 8/31/20
-
What Do The Cycles Say About 2020?
— 1/21/20
-
Modeling 2020 Expectations (Just For Fun)
— 1/13/20
-
Tips From Real-World Wendy Rhoades
— 5/06/19
-
The Best Recession Ever!
— 4/29/19
-
{[comment.author.username]} {[comment.author.username]} — Marketfy Staff — Maven — Member


- 1 Campus Martius, Suite #200Detroit, MI 48226
- +1 877 440 9464