

The Weight of the Evidence Remains Positive
Modern times demand modern thinking in portfolio design. Learn more...
Happy Monday. To review, our plan is to begin each week with a review of the important indicator boards. The goal of this exercise is to keep readers "in tune" with the weight of the evidence in the market on an ongoing basis. So, without further ado, let's get to it.
As always, we start with the price/trend of the market. From a shorter-term perspective, it appears that the S&P managed to break above 2075 on April 13 and has since held above this all important line in the sand. While we would expect to see a test of this area (which could include a dip back below 2060) the fact that the stocks did not immediately retrace the move is certainly a positive.
S&P 500 - Daily 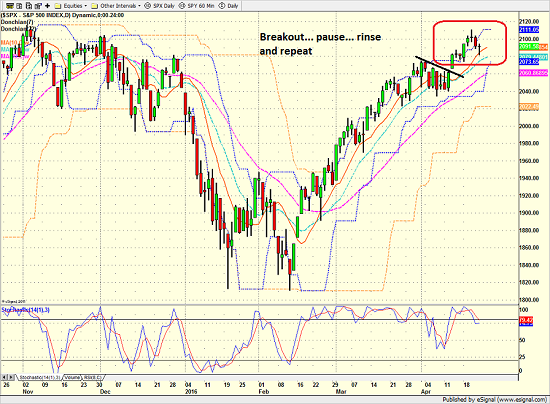
View Larger Image
From a longer-term perspective (e.g. a weekly chart of the S&P 500), once again there really isn't anything new to report. As I have written recently, it looks to me like stocks remain in a sideways consolidation pattern. The thinking is the market continues to digest the big move higher that took place from 2012 through 2014. The good news is the textbooks tell us that stocks tend to exit a consolidation pattern heading in the direction they were going when the pattern began. Therefore, if we assume that stocks are entrenched in a secular bull market, we should expect to see a breakout to the upside - eventually.
S&P 500 - Weekly 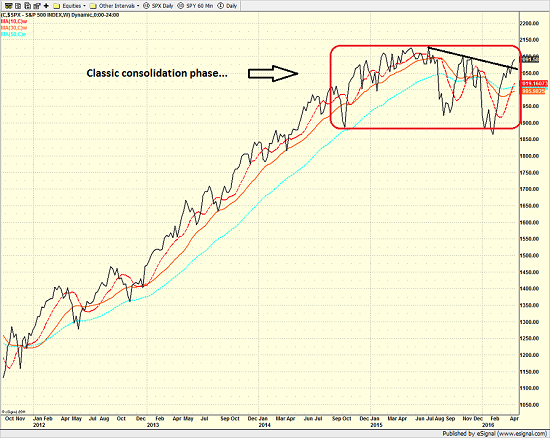
View Larger Image
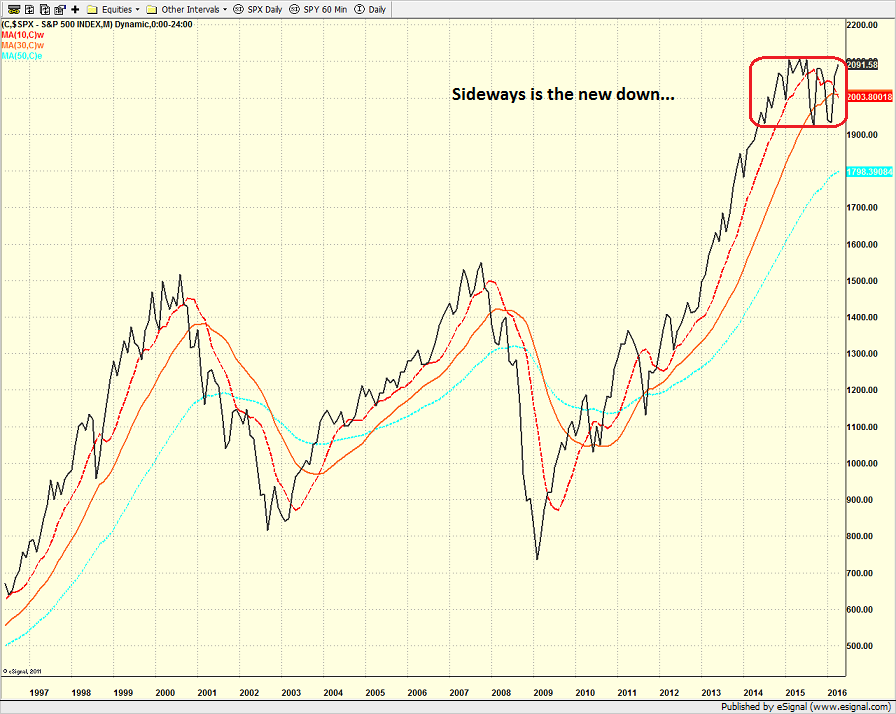
The consolidation argument is even clearer when one looks at a monthly chart of the market.
While this sideways pattern isn't evident anywhere else on the monthly chart of the S&P over the past 20 years, I believe that the era of global central bank intervention (i.e. "QE to infinity and beyond") is the root cause of the sideways action. In short, declines are shallow due to the new capital being created each month while valuations are keeping a lid on the upside. The result is a sideways pattern that is about 15% wide.
S&P 500 - Monthly 
View Larger Image
Next, let's take a look at our objective panel of price indicators...

The first thing to note is that both the short- and intermediate-term channel breakout systems are now neutral. This suggests that there is a pause in the upside action happening.
Next, note that the long-term trend model has been upgraded to neutral. In short, the upwardly sloping 50-day moving average is now within 2 points of the 200-day. As such, it appears to be only a matter of time before the big-picture trend is positive again.
Finally, it is worth pointing out that the cycle composite is down for the next 2-3 weeks as the "Sell in May" season is once again upon us.
Next up is the momentum indicator board...

The first takeaway here is the preponderance of green seen on this indicator panel. In fact, the only thing that isn't positive is the shorter-term volume thrust indicator. But on that note, it is positive that both our short- and long-term volume relationship models are now positive. It has been quite some time since this has been the case! The bottom line here is there is nothing really to worry about from an internal momentum standpoint at this time.
It is also positive that the average historical return of the S&P given the current state of the momentum indicators is well above the norm.
Next up is the "early warning" board, which is designed to indicate when traders may start to "go the other way" for a trade.

The message from this panel remains quite clear. Stocks are overbought and sentiment has become too optimistic. And the bottom line is the market is now "set up" for a reversal/countertrend move. However, as I've said many times in the past, an overbought condition alone is NOT a reason to take action - even from a short-term perspective.
But, it is worth noting that the intermediate-term overbought condition is now the highest since early 2014 and the VIX is sitting at very low levels.
In addition, our sentiment models are all negative at this time and have reached extreme readings. However, just like the price indicators, this type of condition can remain intact for long periods of time. The key to using sentiment as a contrarian indicator is to first wait for an extreme reading and then to let the indicator actually reverse before taking action.
In short, think of this panel as a yellow caution flag being waved. And if you like to "hedge" your positions when things get overdone, this is the type of condition that you may be looking for.
Now let's move on to the market's "external factors" - the indicators designed to tell us the state of the big-picture market drivers including monetary conditions, the economy, inflation, and valuations.

Once again, there is nothing new to report here. But remember, this board doesn't change very often at all.
To review, monetary conditions remain favorable, our economic model is moderately positive, inflation isn't a problem, and valuations remain an area of discussion. This tells us that the odds continue to favor the bulls from a big-picture standpoint.
Finally, let's turn to our favorite big-picture market models, which are designed to tell us which team is in control of the prevailing major trend.

With three of the four models on this board positive, it is hard to argue with the bull case here. It is also worth noting that our Leading Indicators Model (which did a fine job of warning us of impending difficulty last May) hit 90% last week and currently stands at 80%. And given the historical return levels of the current reading, this has to be viewed as a big-picture positive.
The only nagging concern is the Risk/Reward Model. The good news is the model upticked last week. The bad news is the model remains neutral. Remember, this model-of-models contains more than 30 separate market models. Thus, I would prefer to see this model positive during up-trending cycles.
The Takeaway...
To sum up, the "weight of the evidence" suggests that investors should continue to give the bulls the benefit of the doubt here. Momentum looks good. The External Factors Model (on the Primary Cycle Indicators board) is very positive at 93%. And the S&P 500 is a stone's throw from all-time highs.
However, the Early Warning board is akin to a elementary student frantically waving their hand at the back of the room right now. As such, a pullback to first test 2060 and then perhaps 2040 would be logical in the near-term.
In sum, the current situation tells me to be prepared to buy the dips in order to put capital to work.
Publishing Note: I am traveling through the middle of the week with a speaking engagement in Dallas. As always, reports will be published as my schedule permits.
Today's Pre-Game Indicators
Here are the Pre-Market indicators we review each morning before the opening bell...
Major Foreign Markets:
Japan: -0.76%
Hong Kong: -0.76%
Shanghai: -0.42%
London: -0.71%
Germany: -0.68%
France: -0.55%
Italy: -1.06%
Spain: -0.52%
Crude Oil Futures: -$0.29 to $43.44
Gold: +$4.60 at $1234.60
Dollar: higher against the yen, lower vs. euro and pound
US 10-Year Bond Yield: Currently trading at 1.868%
German 10-Year Bund Yield: Currently trading at 0.226%
Stock Indices in U.S. (relative to fair value):
S&P 500: -4.30
Dow Jones Industrial Average: -52
NASDAQ Composite: -12.55
Thought For The Day:
"You can never cross the ocean until you have the courage to lose sight of the shore." -Christopher Columbus
Here's wishing you green screens and all the best for a great day,

David D. Moenning
Founder: Heritage Capital Research
Chief Investment Officer: Sowell Management Services
Looking for More on the State of the Markets?
!function(d,s,id){var js,fjs=d.getElementsByTagName(s)[0],p=/^http:/.test(d.location)?'http':'https';if(!d.getElementById(id)){js=d.createElement(s);js.id=id;js.src=p+'://platform.twitter.com/widgets.js';fjs.parentNode.insertBefore(js,fjs);}}(document, 'script', 'twitter-wjs');Disclosures
The opinions and forecasts expressed herein are those of Mr. David Moenning and may not actually come to pass. Mr. Moenning's opinions and viewpoints regarding the future of the markets should not be construed as recommendations. The analysis and information in this report is for informational purposes only. No part of the material presented in this report is intended as an investment recommendation or investment advice. Neither the information nor any opinion expressed constitutes a solicitation to purchase or sell securities or any investment program.
Any investment decisions must in all cases be made by the reader or by his or her investment adviser. Do NOT ever purchase any security without doing sufficient research. There is no guarantee that the investment objectives outlined will actually come to pass. All opinions expressed herein are subject to change without notice. Neither the editor, employees, nor any of their affiliates shall have any liability for any loss sustained by anyone who has relied on the information provided.
The analysis provided is based on both technical and fundamental research and is provided "as is" without warranty of any kind, either expressed or implied. Although the information contained is derived from sources which are believed to be reliable, they cannot be guaranteed.
David D. Moenning is an investment adviser representative of Sowell Management Services, a registered investment advisor. For a complete description of investment risks, fees and services, review the firm brochure (ADV Part 2) which is available by contacting Sowell. Sowell is not registered as a broker-dealer.
Employees and affiliates of Sowell may at times have positions in the securities referred to and may make purchases or sales of these securities while publications are in circulation. Positions may change at any time.
Investments in equities carry an inherent element of risk including the potential for significant loss of principal. Past performance is not an indication of future results.
Advisory services are offered through Sowell Management Services.
Recent free content from FrontRange Trading Co.
-
 Is The Bull Argument Too Easy These Days?
— 8/31/20
Is The Bull Argument Too Easy These Days?
— 8/31/20
-
What Do The Cycles Say About 2020?
— 1/21/20
-
Modeling 2020 Expectations (Just For Fun)
— 1/13/20
-
Tips From Real-World Wendy Rhoades
— 5/06/19
-
The Best Recession Ever!
— 4/29/19
-
{[comment.author.username]} {[comment.author.username]} — Marketfy Staff — Maven — Member


- 1 Campus Martius, Suite #200Detroit, MI 48226
- +1 877 440 9464