

Reasons to Give the Bulls the Benefit of Doubt
Modern times demand modern thinking in portfolio design. Learn more...
One of the benefits of traveling is you have time to step back from the phones, the various forms of electronic communication, and the blinking screens. While sitting in airports and on cramped planes isn't likely high on anybody's list of fun things to do, it does give you time to think.
So in the wee hours of this fine Wednesday morning in Little Rock, I would like to opine that there are reasons to be optimistic about the big picture outlook for the stock market. In fact, there are several pretty good reasons to put away the fear that the next calamity in the stock market may be just around the corner and to put a smile on your face. So, this morning I'd like to explore one of those reasons to turn those stock market frowns upside down.
First and foremost, investors need to remember that stocks go up the vast majority of the time. If you look back at history and do the math (well, I'm actually letting Ned Davis Research do the math for me here), you will discover that since 1900, the stock market has produced positive returns during 73% of all calendar years. Yep, that's right, the odds of making money in the stock market each year are greater than 73%. Not bad.
It is also worth noting that stocks have produced gains over a given 5-year period something like 86% of the time. Then if you go out 10 years, the odds of success are even greater. And if an investor has a 20-year horizon, the odds of success are a nice, round 100%.
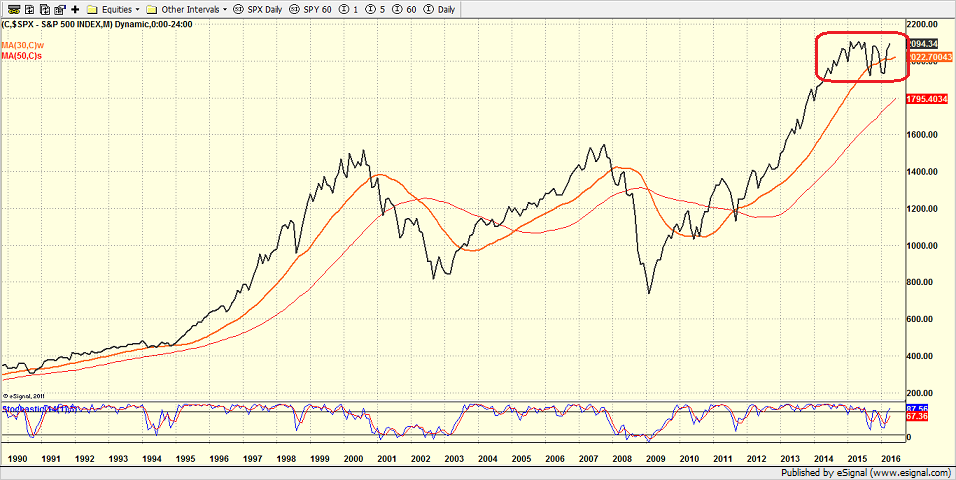
So, while it may feel like owning stocks has been a struggle lately and that the future is scary, I think it is important to look at the bigger picture every once and a while. For example, take a look at the chart below. This is a monthly chart of the S&P 500 going back to 1990. So, we're looking at 26 years of history here.
S&P 500 - Monthly 
View Larger Image
When I look at this chart, the first thing that jumps out at me are the clear bull/bear cycles. Stocks went up in the 1990's. Then they went down between 2000 through 2002. Then they went up until 2008... then down from 2008 through early 2009, and since then, well, stocks have been movin' on up. Anybody else sense a trend here?
The second thing that I'd like to point out is this chart contains (a) the end of the secular bull market that had begun in 1982, (b) a secular bear market (2000-3/9/2009), and (c) what appears to be a new secular bull market.
Why should you care, you ask? There are actually a couple of reasons...
First, while everyone on the planet seems to be worrying about the next big, bad bear market (which, as we're told almost daily, should begin any time now), it is important to remember that bear markets which occur during secular bull periods are much shallower and much shorter than the bears that occur during a secular bear phase.
In fact, according to the folks at Ned Davis Research, we just completed a bear market - a bear that began in August of last year and ended in mid-February. Now be honest; was it really all that bad?
The second important point to take away from this morning's meandering market missive is that the average gains during the up cycles within the context of a secular bull are much larger than average.
According to the computers at NDR, there have been 4 secular bull markets since 1900 (and 4 secular bears). During the secular bulls, the average gain per year for the S&P 500 has been +13.7%. And frankly, if that isn't a reason to look forward to the future, I'm not sure what is.
Yes, I know that everybody under the sun is calling for lower returns going forward. And the reasons for the downbeat outlook do indeed appear to make sense. There is also the fact that stocks have basically gone nowhere since 2014, which is used as an argument as to why we should expect more of the same going forward.
But seeing as how I'm looking at the glass as being at least half full this morning, let me offer up an opposing view.
Take another look at the monthly chart above. From my seat, I see the current sideways action as a consolidation of the big run that occurred over the prior 5 years. And since consolidation patterns are usually resolved by the market resuming the trend that had been in place before the consolidation phase began, we should probably expect this consolidation to end with an upside breakout - at some point in time.
There's the rub, of course. WHEN are stocks going to break out? WHEN will this game become fun again? WHEN will investors be able to make more than a few percentage points in their portfolios?
In all honesty, I can't answer that question. But, looking at the big picture and the history of the stock market, the odds would seem to be in the bulls' favor here. Next time, we'll explore a couple more reasons to give the bulls the benefit of the doubt going forward.
Publishing Note: I am traveling through the middle of next week. As always, reports will be published as my schedule permits.
Today's Pre-Game Indicators
Here are the Pre-Market indicators we review each morning before the opening bell...
Major Foreign Markets:
Japan: +0.19%
Hong Kong: -0.93%
Shanghai: -2.31%
London: -0.25%
Germany: +0.14%
France: +0.16%
Italy: +0.21%
Spain: +1.08%
Crude Oil Futures: -$0.90 to $40.18
Gold: -3.20 at $1244.30
Dollar: lower against the yen and euro, higher vs. pound
US 10-Year Bond Yield: Currently trading at 1.777%
German 10-Year Bund Yield: Currently trading at 0.167%
Stock Indices in U.S. (relative to fair value):
S&P 500:
Dow Jones Industrial Average:
NASDAQ Composite:
Thought For The Day:
Simplicity is the ultimate sophistication. -Leonardo da Vinci
Here's wishing you green screens and all the best for a great day,

David D. Moenning
Founder: Heritage Capital Research
Chief Investment Officer: Sowell Management Services
Looking for More on the State of the Markets?
!function(d,s,id){var js,fjs=d.getElementsByTagName(s)[0],p=/^http:/.test(d.location)?'http':'https';if(!d.getElementById(id)){js=d.createElement(s);js.id=id;js.src=p+'://platform.twitter.com/widgets.js';fjs.parentNode.insertBefore(js,fjs);}}(document, 'script', 'twitter-wjs');Disclosures
The opinions and forecasts expressed herein are those of Mr. David Moenning and may not actually come to pass. Mr. Moenning's opinions and viewpoints regarding the future of the markets should not be construed as recommendations. The analysis and information in this report is for informational purposes only. No part of the material presented in this report is intended as an investment recommendation or investment advice. Neither the information nor any opinion expressed constitutes a solicitation to purchase or sell securities or any investment program.
Any investment decisions must in all cases be made by the reader or by his or her investment adviser. Do NOT ever purchase any security without doing sufficient research. There is no guarantee that the investment objectives outlined will actually come to pass. All opinions expressed herein are subject to change without notice. Neither the editor, employees, nor any of their affiliates shall have any liability for any loss sustained by anyone who has relied on the information provided.
The analysis provided is based on both technical and fundamental research and is provided "as is" without warranty of any kind, either expressed or implied. Although the information contained is derived from sources which are believed to be reliable, they cannot be guaranteed.
David D. Moenning is an investment adviser representative of Sowell Management Services, a registered investment advisor. For a complete description of investment risks, fees and services, review the firm brochure (ADV Part 2) which is available by contacting Sowell. Sowell is not registered as a broker-dealer.
Employees and affiliates of Sowell may at times have positions in the securities referred to and may make purchases or sales of these securities while publications are in circulation. Positions may change at any time.
Investments in equities carry an inherent element of risk including the potential for significant loss of principal. Past performance is not an indication of future results.
Advisory services are offered through Sowell Management Services.
Recent free content from FrontRange Trading Co.
-
 Is The Bull Argument Too Easy These Days?
— 8/31/20
Is The Bull Argument Too Easy These Days?
— 8/31/20
-
What Do The Cycles Say About 2020?
— 1/21/20
-
Modeling 2020 Expectations (Just For Fun)
— 1/13/20
-
Tips From Real-World Wendy Rhoades
— 5/06/19
-
The Best Recession Ever!
— 4/29/19
-
{[comment.author.username]} {[comment.author.username]} — Marketfy Staff — Maven — Member


- 1 Campus Martius, Suite #200Detroit, MI 48226
- +1 877 440 9464