

The Weight of the Evidence Suggests...
Modern times demand modern thinking in portfolio design. Learn more...
As I wrote last week, my plan going forward is to start each week with a review of the important indicator groups. While this may not be the greatest "read" to kick off the new week, the goal is to keep readers "in tune" with the weight of the evidence in the market on an ongoing basis. I've learned that if you can stay in sync with what the market "is doing" you aren't likely to be fooled when something big happens.
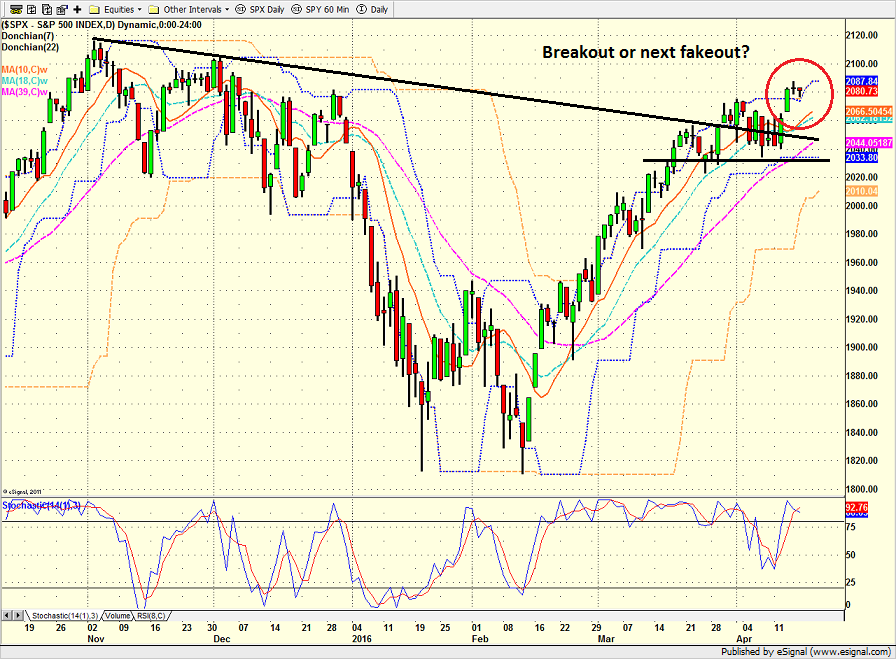
As always, we start with the price/trend of the market. From a shorter-term perspective, stocks are trying to break out from the recent consolidation pattern. However, it is important to keep in mind that traders are hyper-sensitive to earnings at the present time. And in light of the fact that expectations are for this to be another weak reporting season, we should probably keep in mind that a great many "breakouts" that have occurred near new highs have often become "fake-outs." As such, stocks may be vulnerable to bad news at this point in time. Yet at the same time, the trend is up and that's a good thing.
S&P 500 - Daily 
View Larger Image
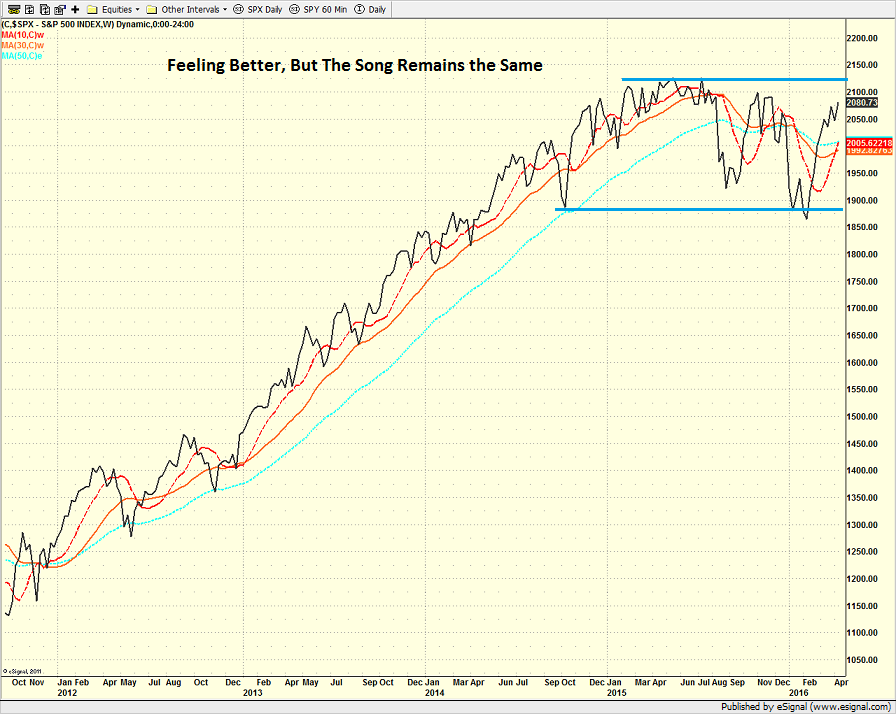
If we step back and look at the situation from a longer-term perspective on a weekly chart of the S&P 500, there really isn't anything new to report. As I wrote last week, from my perch it looks like stocks remain in a sideways consolidation pattern. The thinking is the market continues to digest the big move higher that took place from 2012 through 2014. This is even clearer when one looks at a monthly chart of the market.
S&P 500 - Weekly 
View Larger Image
Next, let's take a look at our objective panel of price indicators...

The first thing to note is there is an awful lot of green on this board as prices are currently at highs for the current cycle. The only glaring negative continues to be the longer-term price model. The model is negative due to (a) the ongoing longer-term downtrend and (b) the relationship of the S&P's 50-day to its 200-day. However, this could easily be resolved if the bulls maintain control of the ball. Finally, two of the three trending vs. mean reverting models continue to suggest stocks remain in a mean reverting mode. However, one of the models flipped to trending in the last week.
Next up is the momentum indicator board...

Things are not quite as positive here, which suggests that the current move is losing steam. Although the market produced several momentum "thrust" buy signals at the beginning of the move (suggesting that the odds favor the bulls for the next 3, 6, and 12 months), there are some problems in the momentum area as well as the relationship of demand volume to supply volume. This tells us that the market is taking a break at the present time, which makes sense given that stocks have run a long way and the earnings parade is just getting started. The bottom line is the average historical return of the S&P given the current state of the momentum indicators is well above the norm.
Next up is the "early warning" board, which is designed to indicate when traders may start to "go the other way" for a trade.

The message from this panel is very clear. Cutting to the chase, stocks are overbought and sentiment has become too optimistic. As such, the market is ripe for a countertrend move. While an overbought condition can be a sign of strength from an intermediate-term perspective, this board tells me that stocks are vulnerable to bad news at the present time. However, as I've said many times prior, an overbought condition alone is NOT a reason to take action - even from a short-term perspective. Think of this being a yellow caution flag being waved.
Now let's move on to the market's "external factors" - the indicators designed to tell us the state of the big-picture market drivers including monetary conditions, the economy, inflation, and valuations.

Nothing new to report here - and to be honest, this board doesn't change very often. Monetary conditions remain favorable, our economic model is now moderately positive, inflation isn't a problem, and valuations remain an area of discussion. This tells us that the odds continue to favor the bulls from a big-picture standpoint.
Finally, let's turn to our favorite big-picture market models, which are designed to tell us which team is in control of the prevailing major trend.

With three of the four models on this board positive, there isn't much discussion to be had. It is worth noting that our leading indicators model has upticked to 80%, which is the highest level since late 2013. And with the historical annual gain per annum for this model sitting at 20%, it is hard to argue the bearish case here. However, the one nagging problem remains the risk/reward model. Personally, I'd feel a whole lot better if this too were positive. So, this remains something to watch.
The Takeaway...
To sum up, the "weight of the evidence" suggests that investors should continue to give the bulls the benefit of the doubt here. The caveat is that the overbought condition and the level of positive sentiment suggests that stocks are vulnerable to bad news and that a pullback to test support is to be expected in the near-term. Thus, a buy-the-dip approach would seem to be appropriate at this time.
Publishing Note: I am traveling through the middle of next week. As always, reports will be published as my schedule permits. P.S. My father is now home from the hospital - thanks to all for the kind words and well wishes.
Today's Pre-Game Indicators
Here are the Pre-Market indicators we review each morning before the opening bell...
Major Foreign Markets:
Japan: -3.40%
Hong Kong: -0.73%
Shanghai: -1.44%
London: -0.25%
Germany: +0.06%
France: -0.18%
Italy: +0.17%
Spain: -0.49%
Crude Oil Futures: -$1.42 to $38.94
Gold: +$4.30 at $1239.10
Dollar: higher against the yen and pound, lower vs. euro
US 10-Year Bond Yield: Currently trading at 1.747%
German 10-Year Bund Yield: Currently trading at 0.016%
Stock Indices in U.S. (relative to fair value):
S&P 500: -5.38
Dow Jones Industrial Average: -44
NASDAQ Composite: -10.11
Thought For The Day:
"Always stay humble and kind" -Tim McGraw
Here's wishing you green screens and all the best for a great day,

David D. Moenning
Founder: Heritage Capital Research
Chief Investment Officer: Sowell Management Services
Looking for More on the State of the Markets?
!function(d,s,id){var js,fjs=d.getElementsByTagName(s)[0],p=/^http:/.test(d.location)?'http':'https';if(!d.getElementById(id)){js=d.createElement(s);js.id=id;js.src=p+'://platform.twitter.com/widgets.js';fjs.parentNode.insertBefore(js,fjs);}}(document, 'script', 'twitter-wjs');Disclosures
The opinions and forecasts expressed herein are those of Mr. David Moenning and may not actually come to pass. Mr. Moenning's opinions and viewpoints regarding the future of the markets should not be construed as recommendations. The analysis and information in this report is for informational purposes only. No part of the material presented in this report is intended as an investment recommendation or investment advice. Neither the information nor any opinion expressed constitutes a solicitation to purchase or sell securities or any investment program.
Any investment decisions must in all cases be made by the reader or by his or her investment adviser. Do NOT ever purchase any security without doing sufficient research. There is no guarantee that the investment objectives outlined will actually come to pass. All opinions expressed herein are subject to change without notice. Neither the editor, employees, nor any of their affiliates shall have any liability for any loss sustained by anyone who has relied on the information provided.
The analysis provided is based on both technical and fundamental research and is provided "as is" without warranty of any kind, either expressed or implied. Although the information contained is derived from sources which are believed to be reliable, they cannot be guaranteed.
David D. Moenning is an investment adviser representative of Sowell Management Services, a registered investment advisor. For a complete description of investment risks, fees and services, review the firm brochure (ADV Part 2) which is available by contacting Sowell. Sowell is not registered as a broker-dealer.
Employees and affiliates of Sowell may at times have positions in the securities referred to and may make purchases or sales of these securities while publications are in circulation. Positions may change at any time.
Investments in equities carry an inherent element of risk including the potential for significant loss of principal. Past performance is not an indication of future results.
Advisory services are offered through Sowell Management Services.
Recent free content from FrontRange Trading Co.
-
 Is The Bull Argument Too Easy These Days?
— 8/31/20
Is The Bull Argument Too Easy These Days?
— 8/31/20
-
What Do The Cycles Say About 2020?
— 1/21/20
-
Modeling 2020 Expectations (Just For Fun)
— 1/13/20
-
Tips From Real-World Wendy Rhoades
— 5/06/19
-
The Best Recession Ever!
— 4/29/19
-
{[comment.author.username]} {[comment.author.username]} — Marketfy Staff — Maven — Member


- 1 Campus Martius, Suite #200Detroit, MI 48226
- +1 877 440 9464