

Give The Bulls The Benefit Of Doubt
Modern times demand modern thinking in portfolio design. Learn more...
In my humble opinion, the investing game is probably more about discipline than anything else. It is for this reason that I like to do a disciplined review of my indicators on a daily, weekly, and monthly basis. For me, the goal is to try and identify the "message" being delivered from a broad array of indicators. In short, this helps me stay in tune with the "weight of the evidence" of the market - I.E. what "IS" happening in the market (as opposed to what I "think" might be happening in the market).
I've been doing this for many, many years. And it occurred to me recently that while I do occasionally provide a review of these indicators, there isn't really any consistency to it. So, in an effort to keep readers "in tune" with the weight of the evidence in the market on an ongoing basis, my plan going forward is to start each with a review of the important indicator groups.
So, let's get started...
We always start with the price/trend of the market. While price action can definitely be confusing at times - especially these days with high speed trading running the show - it is important to recognize that when viewed from a longer-term perspective, price cannot deviate from itself as an indicator. In other words, it is what it is.
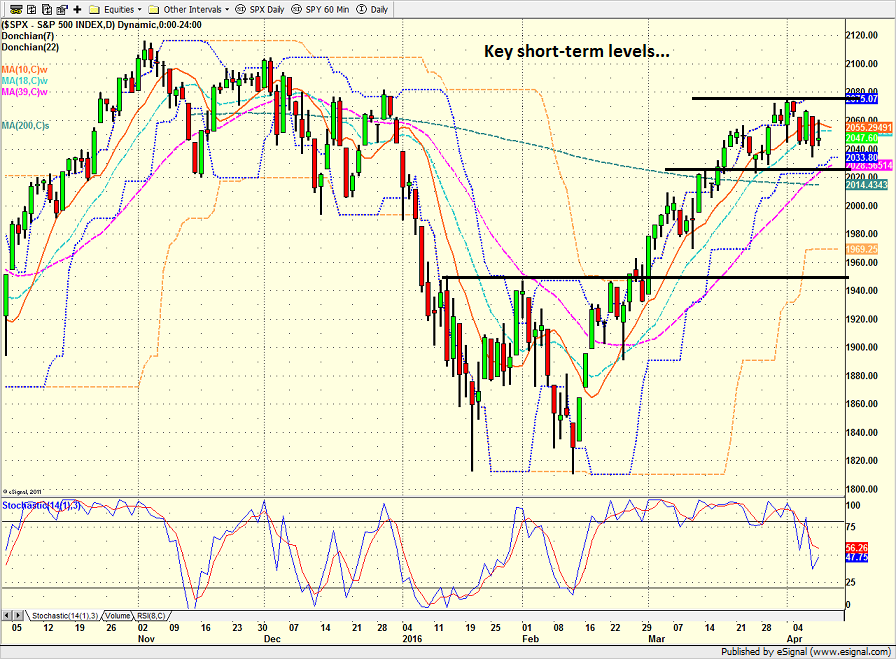
On a shorter-term basis, stocks appear to be in a consolidation mode after the big run from mid-February through April 1. One could also argue that the current sideways action could be tracing out the last part of a cup-with-a-handle formation. But in either case, the lines in the sand are clear.
S&P 500 - Daily 
View Larger Image
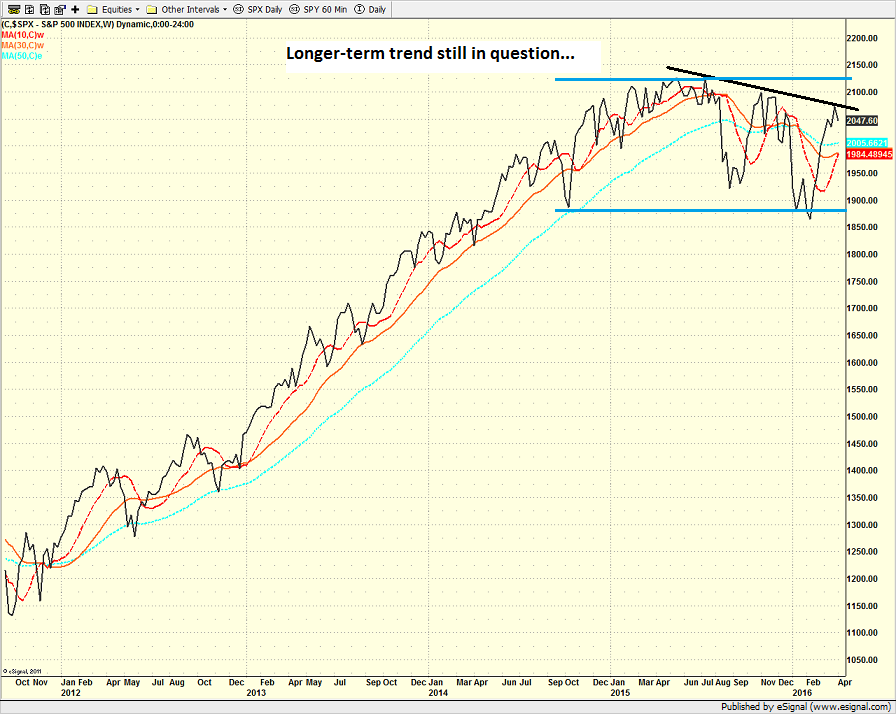
If we step back and look at the situation from a longer-term perspective, I will argue that (a) stocks appear to be consolidating the big move higher from late 2012 and/or (b) the downtrend that began last summer remains intact. Thus, the longer-term trend remains a question mark at this point.
S&P 500 - Weekly 
View Larger Image
Now that the subjective analysis is out of the way, let's take a look at our indicator panels to see what the message from the models is this week.

When compared to last week, the price board is not nearly as positive as it was. The short-term trend has turned neutral, our channel breakout indicators are waiting to see if the bulls will be able to mount a charge, the cycle composite remains neutral, and the market continues to trade in a mean-reverting environment. In fact, the only positive is the fact that the S&P 500 remains above its upwardly sloping 10-week moving average.
Next, let's look at the momentum indicators...

Given the impressive momentum seen during the early part of the recent rally, this indicator board remains in pretty good shape. But with stocks having stalled out a bit over the last week and a half, it isn't surprising to see the short-term trend and breadth confirm model now neutral. And as you can see from the historical return of this indicator, a neutral reading has produced better than average returns. The same thing can be said for the volume and breadth thrust indicators - both have slipped to neutral, but the historical returns for the neutral mode are high. In addition, it is a good sign that the intermediate-term model remains positive. Also in the positive category is the industry health model (aka my "desert island indicator") and the short-term price thrust indicator.
The glaring negative on the board here is the relationship of demand volume to supply volume as both are currently negative.
Finally, it is worth noting that the average historical return of this model set is still above the mean seen since 1900, which stands at around 9.9%.
Next up is the "early warning" board, which is designed to indicate when traders may start to "go the other way" for a trade.

One glance at this group of indicators tells the whole story from a short-term perspective. Stocks remain overbought (although the short-term overbought condition has been worked off), sentiment indicators are largely negative, and the VIX indicator continues to wave a warning flag. In short, this panel continues to suggest that the table is not yet "set" for a strong move higher.
Of course, it is vital to recognize that fortunes have been lost assuming that overbought conditions always lead to lower prices. Remember, a sustained overbought condition should be viewed as a sign of strength during meaningful rallies - and can remain in place for long periods of time.
Next, let's move on to the market's "external factors" - the indicators designed to tell us the state of the big-picture market drivers including monetary conditions, the economy, inflation, and valuations.

There is nothing new to report here. Monetary conditions are moderately positive due to rates remaining extremely low, the economic model is moderately positive, the inflation model has improved recently, and the valuation models are a wash. But overall, this board tells us that the backdrop from stocks is favorable.
Finally, let's turn to our favorite big-picture market models, which are designed to tell us which team is in control of the prevailing major trend.

The big change here is the fact that the Leading Indicators Model has continued to improve, upticking first from neutral to moderately positive, and then to a positive reading last week as 70% of the indicators in the model are now green. And as I mentioned last time, it is important to note that unlike so many indicators, this model has done a very good job identifying the overall environment.
Unfortunately, the "risk/reward" model has refused to improve and remains neutral. However, as you can see from the historical return reading, stocks can advance at a decent rate with this model in the neutral mode.
And finally, there is the "external factors" model, which is a single model summarizing the state of monetary, sentiment, valuation and economic indicators. However, we need to note that unlike our "external factors" panel above, this valuation model focuses on valuations relative to interest rates, which remains positive. Thus, this makes this model set quite positive.
The Takeaway...
To sum up, prices have stalled out over the past week and a half. But so far at least, the move appears to be a consolidation phase (a break below 2020 would change this view). The same can be said for the state of the longer-term trend as stocks have been in a sideways consolidation phase for the better part of the last year and a half (the SPX is currently sitting at a price seen in the fall of 2014). Therefore, prices will need to move above or below the key lines in the sand for things to change.
Our momentum indicators are moderately positive on balance and suggests we should lean bullish here, despite the fact that the early warning models are saying a deeper pullback is possible in the near-term. And with both the external factor and primary cycle panels looking fairly positive, the bottom line is the weight of the evidence is bullish from a big-picture perspective.
So, while things have gotten a bit sloppy in front of earnings season, the overall message from the "weight of the evidence" suggests that investors should continue to give the bulls the benefit of the doubt here.
Publishing Note: I am traveling the next two weeks (checking in on my Dad in Illinois this week). As always, reports will be published as my schedule permits.
Today's Pre-Game Indicators
Here are the Pre-Market indicators we review each morning before the opening bell...
Major Foreign Markets:
Japan: -0.44%
Hong Kong: +0.35%
Shanghai: +1.64%
London: -0.02%
Germany: +0.99%
France: +0.53%
Italy: +1.62%
Spain: +1.42%
Crude Oil Futures: -$0.07 to $39.65
Gold: +$7.00 at $1250.80
Dollar: lower against the yen, euro and pound
US 10-Year Bond Yield: Currently trading at 1.737%
German 10-Year Bund Yield: Currently trading at 0.119%
Stock Indices in U.S. (relative to fair value):
S&P 500: +7.60
Dow Jones Industrial Average: +48
NASDAQ Composite: +15.75
Thought For The Day:
The creation of a thousand forests is in one acorn. - Ralph Waldo Emerson
Here's wishing you green screens and all the best for a great day,

David D. Moenning
Founder: Heritage Capital Research
Chief Investment Officer: Sowell Management Services
Looking for More on the State of the Markets?
!function(d,s,id){var js,fjs=d.getElementsByTagName(s)[0],p=/^http:/.test(d.location)?'http':'https';if(!d.getElementById(id)){js=d.createElement(s);js.id=id;js.src=p+'://platform.twitter.com/widgets.js';fjs.parentNode.insertBefore(js,fjs);}}(document, 'script', 'twitter-wjs');Disclosures
The opinions and forecasts expressed herein are those of Mr. David Moenning and may not actually come to pass. Mr. Moenning's opinions and viewpoints regarding the future of the markets should not be construed as recommendations. The analysis and information in this report is for informational purposes only. No part of the material presented in this report is intended as an investment recommendation or investment advice. Neither the information nor any opinion expressed constitutes a solicitation to purchase or sell securities or any investment program.
Any investment decisions must in all cases be made by the reader or by his or her investment adviser. Do NOT ever purchase any security without doing sufficient research. There is no guarantee that the investment objectives outlined will actually come to pass. All opinions expressed herein are subject to change without notice. Neither the editor, employees, nor any of their affiliates shall have any liability for any loss sustained by anyone who has relied on the information provided.
The analysis provided is based on both technical and fundamental research and is provided "as is" without warranty of any kind, either expressed or implied. Although the information contained is derived from sources which are believed to be reliable, they cannot be guaranteed.
David D. Moenning is an investment adviser representative of Sowell Management Services, a registered investment advisor. For a complete description of investment risks, fees and services, review the firm brochure (ADV Part 2) which is available by contacting Sowell. Sowell is not registered as a broker-dealer.
Employees and affiliates of Sowell may at times have positions in the securities referred to and may make purchases or sales of these securities while publications are in circulation. Positions may change at any time.
Investments in equities carry an inherent element of risk including the potential for significant loss of principal. Past performance is not an indication of future results.
Advisory services are offered through Sowell Management Services.
Recent free content from FrontRange Trading Co.
-
 Is The Bull Argument Too Easy These Days?
— 8/31/20
Is The Bull Argument Too Easy These Days?
— 8/31/20
-
What Do The Cycles Say About 2020?
— 1/21/20
-
Modeling 2020 Expectations (Just For Fun)
— 1/13/20
-
Tips From Real-World Wendy Rhoades
— 5/06/19
-
The Best Recession Ever!
— 4/29/19
-
{[comment.author.username]} {[comment.author.username]} — Marketfy Staff — Maven — Member


- 1 Campus Martius, Suite #200Detroit, MI 48226
- +1 877 440 9464