

Is It Time To Worry Again?
Modern times demand modern thinking in portfolio design. Learn more...
From my perch, the key takeaway from the action in the stock market over the past two weeks is that uncertainty has returned in a big way to the corner of Broad and Wall. After romping higher from February 12 through April 1, suddenly the outlook for stocks has become murky. Gone is the fear that the crude's rude move was going to wreck the global economy. Gone is the worry that systemic risk had returned and that investors were facing a redux of 2008. No, after a 13.3% "sigh of relief rally" in the stock market, which pushed the S&P 500 back to within spitting distance of a fresh all-time high, the question has become, where do we go from here?
To be sure, stocks have been waffling back and forth lately. Down one minute, up the next. With the end result being a sideways trading range - aka a "consolidation phase." The bulls argue that the current trading represents a pause in the action and that a new upleg is underway. On the other side of the court though, our furry friends from the bear camp remind us that all is not well in the world and that the next logical move in the stock market is down.
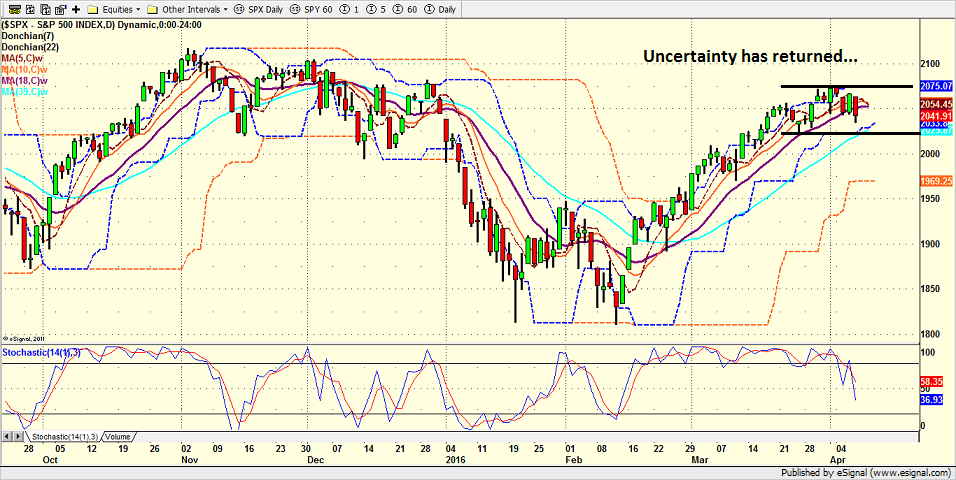
In my humble opinion, a glance at the current daily chart of the S&P paints this picture rather nicely.
S&P 500 - Daily 
View Larger Image
And then if one steps back and looks at the situation from a longer-term perspective, it is also clear that neither team can claim control of the game at this time.
S&P 500 - Weekly 
View Larger Image
While technical analysis is more art than science - especially these days when every investor on the planet has charts at their fingertips 24/7 - I can make the argument that the bulls have yet to break out of the downtrend that is evident on the weekly chart of the S&P. And until this happens, the stock market is likely to remain vulnerable to any/all bad news.
But before you run out and start loading up on those levered, inverse ETFs because the next move is "so obvious," let's also consider that stocks have run a very long way in a very short period of time (again) and that a pause in the action is to be expected. And I do believe that the bulls have earned the benefit of the doubt here - as long as the S&P can stay above 2000, that is.
What Me Worry?
However, the market's "issues" have returned over the past week or so. And while I believe that the current sloppy action may indeed represent a consolidation phase when all is said and done, it is always a good idea to understand your opponent's point of view. So, let's spend our remaining time on this fine Friday morning exploring the bear camp's primary concerns.
Below is an executive summary of the worry list making the rounds with a brief description of each.
- The Yen: In case you haven't noticed, the yen is soaring this week. The worry here is two-fold. First, there is the fear that the BOJ has lost control of the situation. And second, it is important to understand that the unexpected move higher in the yen causes pain in carry trades, which creates short-covering, which yada, yada, yada...
- The European Banks: Don't look now fans, but the banks, especially the European banks, are having a rough go of it again. Take a peek at the chart of Deutsche Bank (NYSE: DB) and you'll see what I mean. The fear here is that there is trouble on the balance sheets of the European banks that has not been recognized at this time. In addition, negative rates don't help the situation at all.
- The U.S. Banks: Take a look at a chart of the banking index or the SPDR S&P Bank ETF (NYSE: KBE) and you'll see that while the situation in the U.S. isn't as bad as it is in Europe, the trend of the U.S. banks isn't going in the right direction. It is also worth noting that the problem isn't limited to the banks as the entire financial sector appears to also be struggling. And as the saying goes, the stock market can't rally (for long) without the financials.
- The Commodity Complex: In addition to what could be described as a resumption in the decline in oil, traders point to the action in "Dr. Copper" (NYSE: JJC) as a reason to worry. The thinking is that falling prices in commodities is a strong proxy for the state of the global economy. The good news here is that steel (NYSE: SLX) isn't breaking down. As such, the situation with copper may be more related to fears that the Chinese could soon release their stockpile of metals on the market. This remains something to watch.
- The 10-Year: In case you haven't noticed, the yield on the U.S. 10-year closed yesterday at the second lowest level of 2016. The takeaway here is the economy is not heading in the right direction. 'Nuf said.
- The Earnings Parade: Ready or not, it's time for another earnings parade to begin. At issue here is the fact that earnings have been in decline. As the recent GDP report revealed, corporate profits have now fallen for 5 straight quarters. And the bottom line is this trend can't continue if the bulls have hopes for a sustainable move higher.
The Takeaway...
So there you have it; the laundry list of fears and worries that help explain the recent sloppy action in the stock market is indeed impressive. However, looking at the action this morning, we find that oil is spiking up more than 5% and surprise, surprise, European bourses and U.S. stock futures are following suit. As such, we should conclude that until one of the teams can make a meaningful break of the key lines in the sand, the uncertainty will likely remain in place. And this means that sideways action should also be viewed as "normal" at this time.
Have a great weekend!
Today's Pre-Game Indicators
Here are the Pre-Market indicators we review each morning before the opening bell...
Major Foreign Markets:
Japan: +0.46%
Hong Kong: +0.51%
Shanghai: -0.78%
London: +0.83%
Germany: +1.20%
France: +1.15%
Italy: +3.58%
Spain: +1.62%
Crude Oil Futures: +$1.46 to $38.72
Gold: -$1.90 at $1235.60
Dollar: lower against the yen and pound, higher vs. euro
US 10-Year Bond Yield: Currently trading at 1.715%
German 10-Year Bund Yield: Currently trading at 0.103%
Stock Indices in U.S. (relative to fair value):
S&P 500: +17.25
Dow Jones Industrial Average: +129
NASDAQ Composite: +39.86
Thought For The Day:
Faith is taking the first step even when you don't see the whole staircase. - Martin Luther King Jr.
Here's wishing you green screens and all the best for a great day,

David D. Moenning
Founder: Heritage Capital Research
Chief Investment Officer: Sowell Management Services
Looking for More on the State of the Markets?
!function(d,s,id){var js,fjs=d.getElementsByTagName(s)[0],p=/^http:/.test(d.location)?'http':'https';if(!d.getElementById(id)){js=d.createElement(s);js.id=id;js.src=p+'://platform.twitter.com/widgets.js';fjs.parentNode.insertBefore(js,fjs);}}(document, 'script', 'twitter-wjs');Current Market Drivers
We strive to identify the driving forces behind the market action on a daily basis. The thinking is that if we can both identify and understand why stocks are doing what they are doing on a short-term basis; we are not likely to be surprised/blind-sided by a big move. Listed below are what we believe to be the driving forces of the current market (Listed in order of importance).
1. The State of the Oil Crisis
2. The State of Global Central Bank Policy
3. The State of the Stock Market Valuations
4. The State of Global Growth
The State of the Trend
We believe it is important to analyze the market using multiple time-frames. We define short-term as 3 days to 3 weeks, intermediate-term as 3 weeks to 6 months, and long-term as 6 months or more. Below are our current ratings of the three primary trends:
Short-Term Trend (1 - 3 Weeks): Neutral
(Chart below is S&P 500 daily over past 1 month)
Intermediate-Term Trend (1 - 6 Months): Moderately Positive
(Chart below is S&P 500 daily over past 6 months)
Long-Term Trend (6 - 18 Months): Neutral
(Chart below is S&P 500 daily over past 2 years)
Key Technical Areas:
Traders as well as computerized algorithms are generally keenly aware of the important technical levels on the charts from a short-term basis. Below are the levels we deem important to watch today:
- Key Near-Term Support Zone(s) for S&P 500: 2020(ish)
- Key Near-Term Resistance Zone(s): 2080-2135
The State of the Tape
Momentum indicators are designed to tell us about the technical health of a trend - I.E. if there is any "oomph" behind the move. Below are a handful of our favorite indicators relating to the market's "mo"...
- Trend and Breadth Confirmation Indicator (Short-Term): Neutral
- Price Thrust Indicator: Positive
- Volume Thrust Indicator(NASDAQ): Neutral
- Breadth Thrust Indicator (NASDAQ): Neutral
- Short-Term Volume Relationship: Neutral
- Technical Health of 100+ Industry Groups: Moderately Positive
The Early Warning Indicators
Markets travel in cycles. Thus we must constantly be on the lookout for changes in the direction of the trend. Looking at market sentiment and the overbought/sold conditions can provide "early warning signs" that a trend change may be near.
- S&P 500 Overbought/Oversold Conditions:
- Short-Term: Neutral
- Intermediate-Term: Overbought
- Market Sentiment: Our primary sentiment model is Neutral
The State of the Market Environment
One of the keys to long-term success in the stock market is stay in tune with the market's "big picture" environment in terms of risk versus reward.
- Weekly Market Environment Model Reading: Moderately Positive
Indicator Explanations
Trend and Breadth Confirmation Indicator (Short-Term) Explained: History shows the most reliable market moves tend to occur when the breadth indices are in gear with the major market averages. When the breadth measures diverge, investors should take note that a trend reversal may be at hand. This indicator incorporates an All-Cap Dollar Weighted Equity Series and A/D Line. From 1998, when the A/D line is above its 5-day smoothing and the All-Cap Equal Weighted Equity Series is above its 25-day smoothing, the equity index has gained at a rate of +32.5% per year. When one of the indicators is above its smoothing, the equity index has gained at a rate of +13.3% per year. And when both are below, the equity index has lost +23.6% per year.
Price Thrust Indicator Explained: This indicator measures the 3-day rate of change of the Value Line Composite relative to the standard deviation of the 30-day average. When the Value Line's 3-day rate of change have moved above 0.5 standard deviation of the 30-day average ROC, a "thrust" occurs and since 2000, the Value Line Composite has gained ground at a rate of +20.6% per year. When the indicator is below 0.5 standard deviation of the 30-day, the Value Line has lost ground at a rate of -10.0% per year. And when neutral, the Value Line has gained at a rate of +5.9% per year.
Volume Thrust Indicator Explained: This indicator uses NASDAQ volume data to indicate bullish and bearish conditions for the NASDAQ Composite Index. The indicator plots the ratio of the 10-day total of NASDAQ daily advancing volume (i.e., the total volume traded in stocks which rose in price each day) to the 10-day total of daily declining volume (volume traded in stocks which fell each day). This ratio indicates when advancing stocks are attracting the majority of the volume (readings above 1.0) and when declining stocks are seeing the heaviest trading (readings below 1.0). This indicator thus supports the case that a rising market supported by heavier volume in the advancing issues tends to be the most bullish condition, while a declining market with downside volume dominating confirms bearish conditions. When in a positive mode, the NASDAQ Composite has gained at a rate of +38.3% per year, When neutral, the NASDAQ has gained at a rate of +13.3% per year. And when negative, the NASDAQ has lost at a rate of -8.5% per year.
Breadth Thrust Indicator Explained: This indicator uses the number of NASDAQ-listed stocks advancing and declining to indicate bullish or bearish breadth conditions for the NASDAQ Composite. The indicator plots the ratio of the 10-day total of the number of stocks rising on the NASDAQ each day to the 10-day total of the number of stocks declining each day. Using 10-day totals smooths the random daily fluctuations and gives indications on an intermediate-term basis. As expected, the NASDAQ Composite performs much better when the 10-day A/D ratio is high (strong breadth) and worse when the indicator is in its lower mode (weak breadth). The most bullish conditions for the NASDAQ when the 10-day A/D indicator is not only high, but has recently posted an extreme high reading and thus indicated a thrust of upside momentum. Bearish conditions are confirmed when the indicator is low and has recently signaled a downside breadth thrust. In positive mode, the NASDAQ has gained at a rate of +22.1% per year since 1981. In a neutral mode, the NASDAQ has gained at a rate of +14.5% per year. And when in a negative mode, the NASDAQ has lost at a rate of -6.4% per year.
Bull/Bear Volume Relationship Explained: This indicator plots both "supply" and "demand" volume lines. When the Demand Volume line is above the Supply Volume line, the indicator is bullish. From 1981, the stock market has gained at an average annual rate of +11.7% per year when in a bullish mode. When the Demand Volume line is below the Supply Volume line, the indicator is bearish. When the indicator has been bearish, the market has lost ground at a rate of -6.1% per year.
Technical Health of 100 Industry Groups Explained: Designed to provide a reading on the technical health of the overall market, this indicator takes the technical temperature of more than 100 industry sectors each week. Looking back to early 1980, when the model is rated as "positive," the S&P has averaged returns in excess of 23% per year. When the model carries a "neutral" reading, the S&P has returned over 11% per year. But when the model is rated "negative," stocks fall by more than -13% a year on average.
Weekly State of the Market Model Reading Explained:Different market environments require different investing strategies. To help us identify the current environment, we look to our longer-term State of the Market Model. This model is designed to tell us when risk factors are high, low, or uncertain. In short, this longer-term oriented, weekly model tells us whether the odds favor the bulls, bears, or neither team.
Disclosures
The opinions and forecasts expressed herein are those of Mr. David Moenning and may not actually come to pass. Mr. Moenning's opinions and viewpoints regarding the future of the markets should not be construed as recommendations. The analysis and information in this report is for informational purposes only. No part of the material presented in this report is intended as an investment recommendation or investment advice. Neither the information nor any opinion expressed constitutes a solicitation to purchase or sell securities or any investment program.
Any investment decisions must in all cases be made by the reader or by his or her investment adviser. Do NOT ever purchase any security without doing sufficient research. There is no guarantee that the investment objectives outlined will actually come to pass. All opinions expressed herein are subject to change without notice. Neither the editor, employees, nor any of their affiliates shall have any liability for any loss sustained by anyone who has relied on the information provided.
The analysis provided is based on both technical and fundamental research and is provided "as is" without warranty of any kind, either expressed or implied. Although the information contained is derived from sources which are believed to be reliable, they cannot be guaranteed.
David D. Moenning is an investment adviser representative of Sowell Management Services, a registered investment advisor. For a complete description of investment risks, fees and services, review the firm brochure (ADV Part 2) which is available by contacting Sowell. Sowell is not registered as a broker-dealer.
Employees and affiliates of Sowell may at times have positions in the securities referred to and may make purchases or sales of these securities while publications are in circulation. Positions may change at any time.
Investments in equities carry an inherent element of risk including the potential for significant loss of principal. Past performance is not an indication of future results.
Advisory services are offered through Sowell Management Services.
Recent free content from FrontRange Trading Co.
-
 Is The Bull Argument Too Easy These Days?
— 8/31/20
Is The Bull Argument Too Easy These Days?
— 8/31/20
-
What Do The Cycles Say About 2020?
— 1/21/20
-
Modeling 2020 Expectations (Just For Fun)
— 1/13/20
-
Tips From Real-World Wendy Rhoades
— 5/06/19
-
The Best Recession Ever!
— 4/29/19
-
{[comment.author.username]} {[comment.author.username]} — Marketfy Staff — Maven — Member


- 1 Campus Martius, Suite #200Detroit, MI 48226
- +1 877 440 9464