

Still Riding the Range
Modern times demand modern thinking in portfolio design. Learn more...
With the S&P 500 closing Friday just 2.7% below last summer's all-time high, it is safe to say that the bulls have escaped the bears' grasp. But as I've been saying for some time now, the oil correlation trade remains fairly well entrenched. And since oil too has rallied in impressive fashion this year, it is hard to get overly excited about the potential for what by all rights looks like new bull cycle. Cutting to the chase, I remain concerned about what will happen at the corner of Broad and Wall if oil starts to retrace some of the recent pop.
On that note, it is mildly encouraging that stocks have not followed the price of oil around like a little puppy dog lately. In fact, stocks actually rose during the latter half of last week while oil pulled back. And while I'm not willing to declare the correlation trade dead just yet, this IS a step in the right direction.
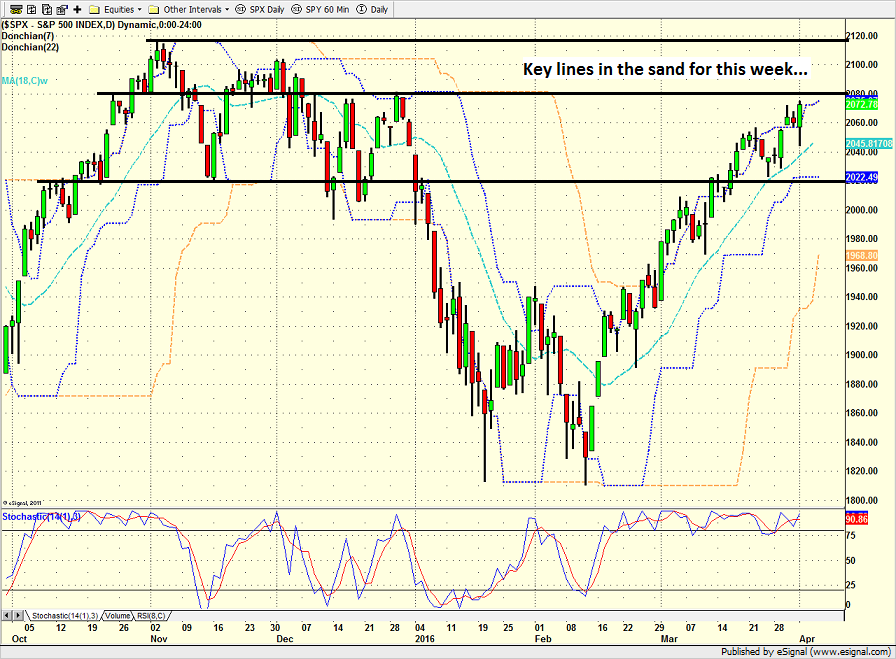
S&P 500 - Daily 
View Larger Image
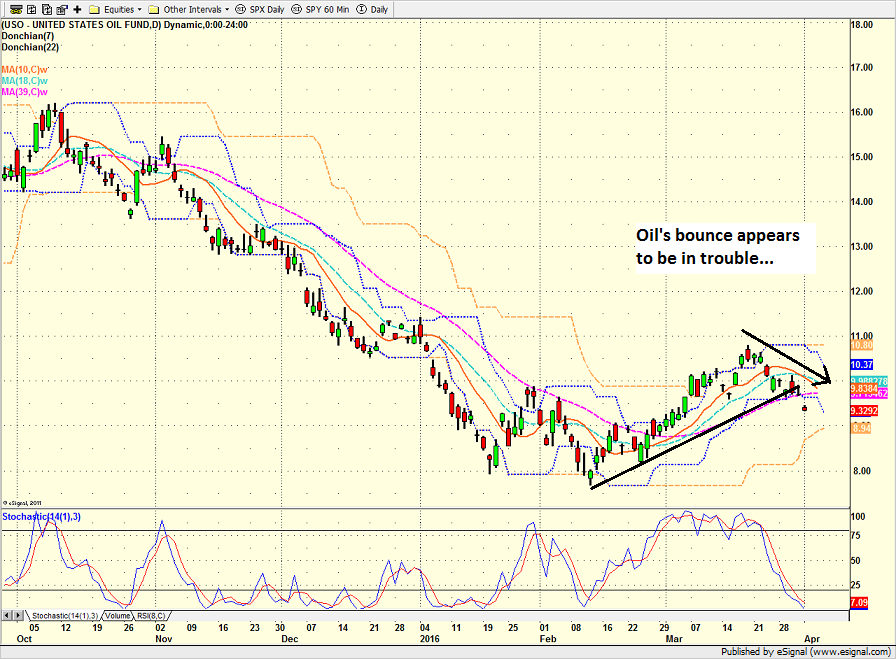
Before we leave the subject of crude, it is important to note that oil's bounce, which is likely to wind up in the "dead cat" category when all is said and done, appears to be in trouble. At issue is the fact that Saudi Arabia said last week that the only way it would cut production is if Iran agrees to also cut back. And since these two countries aren't exactly best buds and most of the Middle East needs the cash from the sale of their oil, it isn't much of a stretch to think that oil could be resuming its rude move lower.
US Oil Fund (NYSE: USO) - Daily 
View Larger Image
As I mentioned at the outset, the good news is that stocks have ignored crude's decline - at least for now. And it would appear that the key to the recent gains in the stock market really isn't about oil but rather all the Fedspeak central banker talk.
Has The Fed Become the Focal Point Again?
To be sure, Janet Yellen deserves much of the credit for the S&P 500 closing last week at the highest levels of the year. You see, the Fed Chair surprised markets Tuesday with a decidedly dovish tone in her speech to the Economic Club of New York.
In short, Yellen said that caution in raising rates is "especially warranted" at this time. In response to this and other rather dovish comments - including the words "further stimulus" (and to be honest, I'm still shaking my head on that one) - traders immediately scratched the potential for an April rate hike from the board and wondered aloud whether the Fed is still bent on returning rates to more normal levels any time soon. And some are even arguing that the dollar has become a focal point as a falling dollar cures all kinds of global ills.
With the Yellen Fed appearing amenable to doing whatever it takes to get some inflation percolating - and even appearing willing to overshoot the Fed's target here - investors are reminded that stocks remain the only game in town.
So, once again, it looks like the central bankers have saved the day for the stock market. It happened in 2014 (Bullard). It happened in 2015 (Super Mario). And now it has happened again in 2016 (Yellen).
The trend is now quite clear. Stocks enter a corrective phase for any number of reasons. And then, right about the time things start to look ugly, the central bankers step in and say whatever they need to say in order to keep "asset prices" moving higher. All in the name of pushing inflation to their "target" of 2%.
One of the big questions in my mind is how long can the global central bank intervention game continue? Sure, it is great to see the corrections in the stock market stay shallow. But can we really assume that this game will continue indefinitely? Time will tell, I guess.
Looking At the Bigger Picture
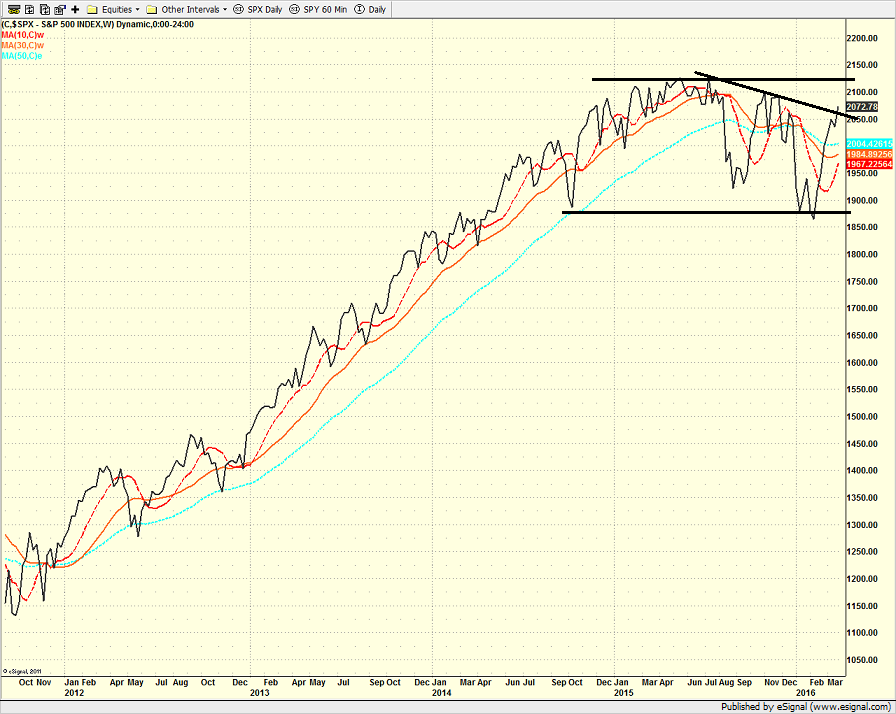
Looking at the stock market from a longer-term perspective, the weekly chart of the S&P 500 shows that stocks have made no progress since the fourth quarter of 2014. In other words, stocks have been moving sideways now for 18 months.
S&P 500 - Weekly 
View Larger Image
Here's my take on the situation. Stocks have been supported on the downside by the global central bankers. Each and every time the market starts to decline the central banker cavalry rides. This causes traders to remember that the Fed usually gets what they want and a rally quickly ensues. So, the "Fed Put" would appear to be alive and well.
However, the rallies have tended to fail when stocks approach the old highs. Why? In short, because (a) valuations remain high, (b) corporate profits have declined for 5 straight quarters, and (c) the threat of systemic risk from the oil bust.
As such, it looks stocks are trapped in a trading range that is about 15% wide. And until one of the teams can break on through to the other side, investors should probably play the game accordingly.
Today's Pre-Game Indicators
Here are the Pre-Market indicators we review each morning before the opening bell...
Major Foreign Markets:
Japan: -0.25%
Hong Kong: -1.34%
Shanghai: +0.19%
London: +0.54%
Germany: +0.68%
France: +0.66%
Italy: -0.13%
Spain: +0.27%
Crude Oil Futures: +$0.11 to $36.90
Gold: -$1.00 at $1222.40
Dollar: higher against the yen, lower vs. euro and pound
US 10-Year Bond Yield: Currently trading at 1.768%
German 10-Year Bund Yield: Currently trading at 0.140%
Stock Indices in U.S. (relative to fair value):
S&P 500: +2.45
Dow Jones Industrial Average: +19
NASDAQ Composite: +6.85
Thought For The Day:
The art of being wise is knowing what to overlook. -William James
Here's wishing you green screens and all the best for a great day,

David D. Moenning
Founder: Heritage Capital Research
Chief Investment Officer: Sowell Management Services
Looking for More on the State of the Markets?
!function(d,s,id){var js,fjs=d.getElementsByTagName(s)[0],p=/^http:/.test(d.location)?'http':'https';if(!d.getElementById(id)){js=d.createElement(s);js.id=id;js.src=p+'://platform.twitter.com/widgets.js';fjs.parentNode.insertBefore(js,fjs);}}(document, 'script', 'twitter-wjs');Current Market Drivers
We strive to identify the driving forces behind the market action on a daily basis. The thinking is that if we can both identify and understand why stocks are doing what they are doing on a short-term basis; we are not likely to be surprised/blind-sided by a big move. Listed below are what we believe to be the driving forces of the current market (Listed in order of importance).
1. The State of the Oil Crisis
2. The State of Global Central Bank Policy
3. The State of the Stock Market Valuations
4. The State of Global Growth
The State of the Trend
We believe it is important to analyze the market using multiple time-frames. We define short-term as 3 days to 3 weeks, intermediate-term as 3 weeks to 6 months, and long-term as 6 months or more. Below are our current ratings of the three primary trends:
Short-Term Trend (1 - 3 Weeks): Positive
(Chart below is S&P 500 daily over past 1 month)
Intermediate-Term Trend (1 - 6 Months): Moderately Positive
(Chart below is S&P 500 daily over past 6 months)
Long-Term Trend (6 - 18 Months): Neutral
(Chart below is S&P 500 daily over past 2 years)
Key Technical Areas:
Traders as well as computerized algorithms are generally keenly aware of the important technical levels on the charts from a short-term basis. Below are the levels we deem important to watch today:
- Key Near-Term Support Zone(s) for S&P 500: 2050(ish)
- Key Near-Term Resistance Zone(s): 2080-2135
The State of the Tape
Momentum indicators are designed to tell us about the technical health of a trend - I.E. if there is any "oomph" behind the move. Below are a handful of our favorite indicators relating to the market's "mo"...
- Trend and Breadth Confirmation Indicator (Short-Term): Positive
- Price Thrust Indicator: Positive
- Volume Thrust Indicator(NASDAQ): Neutral
- Breadth Thrust Indicator (NASDAQ): Moderately Positive
- Short-Term Volume Relationship: Positive
- Technical Health of 100+ Industry Groups: Moderately Positive
The Early Warning Indicators
Markets travel in cycles. Thus we must constantly be on the lookout for changes in the direction of the trend. Looking at market sentiment and the overbought/sold conditions can provide "early warning signs" that a trend change may be near.
- S&P 500 Overbought/Oversold Conditions:
- Short-Term: Overbought
- Intermediate-Term: Overbought
- Market Sentiment: Our primary sentiment model is Neutral
The State of the Market Environment
One of the keys to long-term success in the stock market is stay in tune with the market's "big picture" environment in terms of risk versus reward.
- Weekly Market Environment Model Reading: Moderately Positive
Indicator Explanations
Trend and Breadth Confirmation Indicator (Short-Term) Explained: History shows the most reliable market moves tend to occur when the breadth indices are in gear with the major market averages. When the breadth measures diverge, investors should take note that a trend reversal may be at hand. This indicator incorporates an All-Cap Dollar Weighted Equity Series and A/D Line. From 1998, when the A/D line is above its 5-day smoothing and the All-Cap Equal Weighted Equity Series is above its 25-day smoothing, the equity index has gained at a rate of +32.5% per year. When one of the indicators is above its smoothing, the equity index has gained at a rate of +13.3% per year. And when both are below, the equity index has lost +23.6% per year.
Price Thrust Indicator Explained: This indicator measures the 3-day rate of change of the Value Line Composite relative to the standard deviation of the 30-day average. When the Value Line's 3-day rate of change have moved above 0.5 standard deviation of the 30-day average ROC, a "thrust" occurs and since 2000, the Value Line Composite has gained ground at a rate of +20.6% per year. When the indicator is below 0.5 standard deviation of the 30-day, the Value Line has lost ground at a rate of -10.0% per year. And when neutral, the Value Line has gained at a rate of +5.9% per year.
Volume Thrust Indicator Explained: This indicator uses NASDAQ volume data to indicate bullish and bearish conditions for the NASDAQ Composite Index. The indicator plots the ratio of the 10-day total of NASDAQ daily advancing volume (i.e., the total volume traded in stocks which rose in price each day) to the 10-day total of daily declining volume (volume traded in stocks which fell each day). This ratio indicates when advancing stocks are attracting the majority of the volume (readings above 1.0) and when declining stocks are seeing the heaviest trading (readings below 1.0). This indicator thus supports the case that a rising market supported by heavier volume in the advancing issues tends to be the most bullish condition, while a declining market with downside volume dominating confirms bearish conditions. When in a positive mode, the NASDAQ Composite has gained at a rate of +38.3% per year, When neutral, the NASDAQ has gained at a rate of +13.3% per year. And when negative, the NASDAQ has lost at a rate of -8.5% per year.
Breadth Thrust Indicator Explained: This indicator uses the number of NASDAQ-listed stocks advancing and declining to indicate bullish or bearish breadth conditions for the NASDAQ Composite. The indicator plots the ratio of the 10-day total of the number of stocks rising on the NASDAQ each day to the 10-day total of the number of stocks declining each day. Using 10-day totals smooths the random daily fluctuations and gives indications on an intermediate-term basis. As expected, the NASDAQ Composite performs much better when the 10-day A/D ratio is high (strong breadth) and worse when the indicator is in its lower mode (weak breadth). The most bullish conditions for the NASDAQ when the 10-day A/D indicator is not only high, but has recently posted an extreme high reading and thus indicated a thrust of upside momentum. Bearish conditions are confirmed when the indicator is low and has recently signaled a downside breadth thrust. In positive mode, the NASDAQ has gained at a rate of +22.1% per year since 1981. In a neutral mode, the NASDAQ has gained at a rate of +14.5% per year. And when in a negative mode, the NASDAQ has lost at a rate of -6.4% per year.
Bull/Bear Volume Relationship Explained: This indicator plots both "supply" and "demand" volume lines. When the Demand Volume line is above the Supply Volume line, the indicator is bullish. From 1981, the stock market has gained at an average annual rate of +11.7% per year when in a bullish mode. When the Demand Volume line is below the Supply Volume line, the indicator is bearish. When the indicator has been bearish, the market has lost ground at a rate of -6.1% per year.
Technical Health of 100 Industry Groups Explained: Designed to provide a reading on the technical health of the overall market, this indicator takes the technical temperature of more than 100 industry sectors each week. Looking back to early 1980, when the model is rated as "positive," the S&P has averaged returns in excess of 23% per year. When the model carries a "neutral" reading, the S&P has returned over 11% per year. But when the model is rated "negative," stocks fall by more than -13% a year on average.
Weekly State of the Market Model Reading Explained:Different market environments require different investing strategies. To help us identify the current environment, we look to our longer-term State of the Market Model. This model is designed to tell us when risk factors are high, low, or uncertain. In short, this longer-term oriented, weekly model tells us whether the odds favor the bulls, bears, or neither team.
Disclosures
The opinions and forecasts expressed herein are those of Mr. David Moenning and may not actually come to pass. Mr. Moenning's opinions and viewpoints regarding the future of the markets should not be construed as recommendations. The analysis and information in this report is for informational purposes only. No part of the material presented in this report is intended as an investment recommendation or investment advice. Neither the information nor any opinion expressed constitutes a solicitation to purchase or sell securities or any investment program.
Any investment decisions must in all cases be made by the reader or by his or her investment adviser. Do NOT ever purchase any security without doing sufficient research. There is no guarantee that the investment objectives outlined will actually come to pass. All opinions expressed herein are subject to change without notice. Neither the editor, employees, nor any of their affiliates shall have any liability for any loss sustained by anyone who has relied on the information provided.
The analysis provided is based on both technical and fundamental research and is provided "as is" without warranty of any kind, either expressed or implied. Although the information contained is derived from sources which are believed to be reliable, they cannot be guaranteed.
David D. Moenning is an investment adviser representative of Sowell Management Services, a registered investment advisor. For a complete description of investment risks, fees and services, review the firm brochure (ADV Part 2) which is available by contacting Sowell. Sowell is not registered as a broker-dealer.
Employees and affiliates of Sowell may at times have positions in the securities referred to and may make purchases or sales of these securities while publications are in circulation. Positions may change at any time.
Investments in equities carry an inherent element of risk including the potential for significant loss of principal. Past performance is not an indication of future results.
Advisory services are offered through Sowell Management Services.
Recent free content from FrontRange Trading Co.
-
 Is The Bull Argument Too Easy These Days?
— 8/31/20
Is The Bull Argument Too Easy These Days?
— 8/31/20
-
What Do The Cycles Say About 2020?
— 1/21/20
-
Modeling 2020 Expectations (Just For Fun)
— 1/13/20
-
Tips From Real-World Wendy Rhoades
— 5/06/19
-
The Best Recession Ever!
— 4/29/19
-
{[comment.author.username]} {[comment.author.username]} — Marketfy Staff — Maven — Member


- 1 Campus Martius, Suite #200Detroit, MI 48226
- +1 877 440 9464