

Did Super Mario Succeed?
Modern times demand modern thinking in portfolio design. Learn more...
Well that was interesting. For the past many years, QE has been the elixir that had been able to cure all ills. Multiple crises in Europe, the downgrade of the U.S. debt rating, the fiscal cliff, adventures in the Middle East, worries about China, and speed bumps in the U.S. economy - all have been overcome when global central bankers committed to doing whatever it took to move inflation (and in turn, asset classes) higher.
So, with Super Mario delivering the goods early yesterday morning - this time surprising to the upside - one might have expected traders around the globe to put aside their fears about the oil bust and celebrate the idea of more capital creation coming to a European bank nearby.
However, it didn't quite work out that way. While the ECB did indeed up its commitment to printing more money and various other measures that won't mean a hill of beans to readers, stocks in the U.S. wound up shrugging their shoulders. The S&P 500 wound up gaining a measly 0.02% on the session, the venerable Dow Jones Industrial Average actually fell 5 points, the NASDAQ dropped 0.3%, and then both the Mid-cap and Small-cap indices declined as well.
So what gives? Why did stocks not rally around Mario's latest bazooka firing?
Two things seem to have stuck in traders collective craws yesterday. First, oil wound up pulling back on the session. And lest we forget, the oil correlation trade has been locked in the "on" position for quite some time now. And oftentimes, once a much-anticipated event such as the ECB Meeting is out of the way, traders quickly turn their attention to something else. (Hence the cliché, "Buy the rumor, sell the news.")
Next up, Mario Draghi himself put a wet blanket on the QE celebration during his press conference. While the ECB President answered questions on any number of topics, it was the subject of future expectations that was the surprise. Instead of sticking with the now famous "whatever it takes" theme (as in the ECB will do whatever it takes to get inflation higher), Super Mario effectively said, don't expect any more rate cuts.
So, like a spoiled child having his candy taken away, stock futures instantly sold off on the headline. And this, when combined with the fact that oil was heading in the wrong direction left the market indices within spitting distance of where they started the day.
There Is Some Good News...
But from a technical/chart perspective, there is actually some good news. In fact, there are actually two reasons to be optimistic when looking at the chart of the S&P 500.
First, there is the fact that stocks put in an "outside day" yesterday. This occurs when both the high and low of the day exceed the respective levels from the day prior. While I do believe that chart watching and technical formations have less value than they did before everybody on the planet had them on their phones, an outside day tends to be a signal that the trend is about to reverse. And since stocks appeared to be in a short-term downtrend, one "could" argue that yesterday was a sign of good things to come. We'll see.
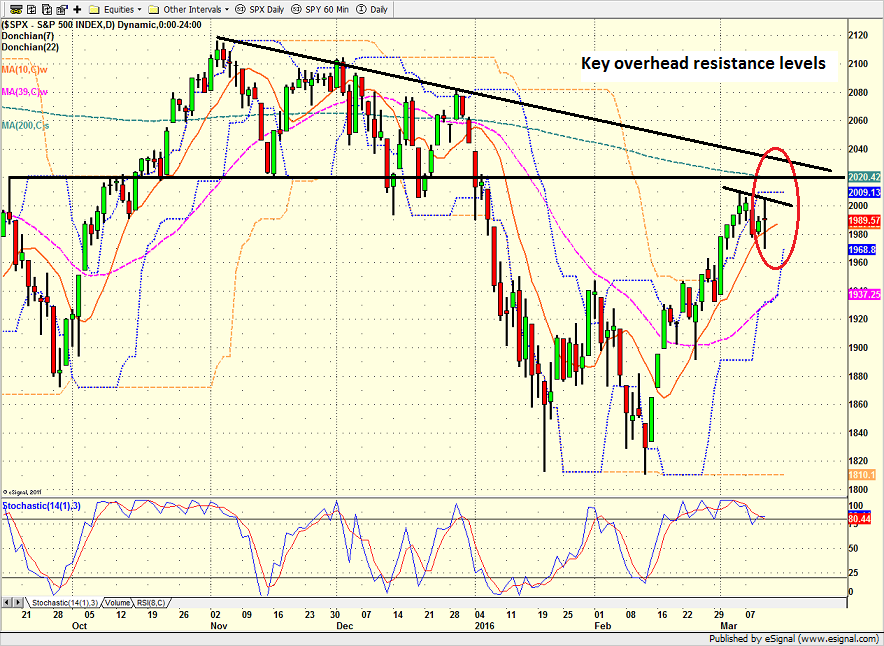
Another potentially positive development on the charts - this time from an intermediate-term perspective - is that the S&P 500 would appear to be tracing out what William O'Neil (founder of Investors Business Daily) termed a "cup with a handle" formation.
This pattern is rooted in investor behavior as a decline is followed by a retest of the lows (which over times forms the base of the cup), which is then followed by a rally (forming the right side of the cup, and then a modest pullback. This pullback, which represents the "handle" of the formation, occurs as traders stop buying for a bit in order to rethink the outlook. And it is when the downtrend line of the handle breaks that a buy signal is given.
S&P 500 - Daily 
View Larger Image
However, I would be remiss if I failed to point out that there is also a fair amount of resistance overhead on the charts. So, while the bulls may have an edge in the near-term, they would appear to have their work cut out for them to convince us that the bear phase has ended. And just to be clear, should stocks break through the 2020 area in convincing fashion, it would be a pretty good argument that what is likely to have been a "mini bear" is over.
Turning to This Morning
Everything seems to be right with the world on this fine Friday morning. In short, traders appear to be rethinking their initial negative view of Draghi's comments. The word this morning is that traders are now focusing on the talk of more "unconventional policy measures" that are still on the table. In addition, oil is moving higher this morning. As a result, European bourses sport a bright shade of green and U.S. futures point to a positive open.
Today's Pre-Game Indicators
Here are the Pre-Market indicators we review each morning before the opening bell...
Major Foreign Markets:
Japan: +0.51%
Hong Kong: +1.08%
Shanghai: +0.20%
London: +1.50%
Germany: +2.97%
France: +2.83%
Italy: +2.82%
Spain: +4.04%
Crude Oil Futures: +$0.79 to $38.62
Gold: -$5.20 at $1267.60
Dollar: lower against the yen and pound, higher vs. euro
US 10-Year Bond Yield: Currently trading at 1.956%
German 10-Year Bund Yield: Currently trading at 0.283%
Stock Indices in U.S. (relative to fair value):
S&P 500: +18.10
Dow Jones Industrial Average: +157
NASDAQ Composite: +47.70
Thought For The Day:
"I knew if I didn't leave my bitterness and hatred behind, I'd still be in prison." -Nelson Mandela
Here's wishing you green screens and all the best for a great day,

David D. Moenning
Founder: Heritage Capital Research
Chief Investment Officer: Sowell Management Services
Looking for More on the State of the Markets?
!function(d,s,id){var js,fjs=d.getElementsByTagName(s)[0],p=/^http:/.test(d.location)?'http':'https';if(!d.getElementById(id)){js=d.createElement(s);js.id=id;js.src=p+'://platform.twitter.com/widgets.js';fjs.parentNode.insertBefore(js,fjs);}}(document, 'script', 'twitter-wjs');Current Market Drivers
We strive to identify the driving forces behind the market action on a daily basis. The thinking is that if we can both identify and understand why stocks are doing what they are doing on a short-term basis; we are not likely to be surprised/blind-sided by a big move. Listed below are what we believe to be the driving forces of the current market (Listed in order of importance).
1. The State of the Oil Crisis
2. The State of Global Central Bank Policy
3. The State of the Stock Market Valuations
4. The State of Global Growth
The State of the Trend
We believe it is important to analyze the market using multiple time-frames. We define short-term as 3 days to 3 weeks, intermediate-term as 3 weeks to 6 months, and long-term as 6 months or more. Below are our current ratings of the three primary trends:
Short-Term Trend (1 - 3 Weeks): Positive
(Chart below is S&P 500 daily over past 1 month)
Intermediate-Term Trend (1 - 6 Months): Neutral
(Chart below is S&P 500 daily over past 6 months)
Long-Term Trend (6 - 18 Months): Moderately Negative
(Chart below is S&P 500 daily over past 2 years)
Key Technical Areas:
Traders as well as computerized algorithms are generally keenly aware of the important technical levels on the charts from a short-term basis. Below are the levels we deem important to watch today:
- Key Near-Term Support Zone(s) for S&P 500: 1950(ish)
- Key Near-Term Resistance Zone(s): 2000-2020
The State of the Tape
Momentum indicators are designed to tell us about the technical health of a trend - I.E. if there is any "oomph" behind the move. Below are a handful of our favorite indicators relating to the market's "mo"...
- Trend and Breadth Confirmation Indicator (Short-Term): Positive
- Price Thrust Indicator: Positive
- Volume Thrust Indicator(NASDAQ): Positive
- Breadth Thrust Indicator (NASDAQ): Positive
- Short-Term Volume Relationship: Positive
- Technical Health of 100+ Industry Groups: Moderately Positive
The Early Warning Indicators
Markets travel in cycles. Thus we must constantly be on the lookout for changes in the direction of the trend. Looking at market sentiment and the overbought/sold conditions can provide "early warning signs" that a trend change may be near.
- S&P 500 Overbought/Oversold Conditions:
- Short-Term: Overbought
- Intermediate-Term: Neutral
- Market Sentiment: Our primary sentiment model is Neutral
The State of the Market Environment
One of the keys to long-term success in the stock market is stay in tune with the market's "big picture" environment in terms of risk versus reward.
- Weekly Market Environment Model Reading: Neutral
Indicator Explanations
Trend and Breadth Confirmation Indicator (Short-Term) Explained: History shows the most reliable market moves tend to occur when the breadth indices are in gear with the major market averages. When the breadth measures diverge, investors should take note that a trend reversal may be at hand. This indicator incorporates an All-Cap Dollar Weighted Equity Series and A/D Line. From 1998, when the A/D line is above its 5-day smoothing and the All-Cap Equal Weighted Equity Series is above its 25-day smoothing, the equity index has gained at a rate of +32.5% per year. When one of the indicators is above its smoothing, the equity index has gained at a rate of +13.3% per year. And when both are below, the equity index has lost +23.6% per year.
Price Thrust Indicator Explained: This indicator measures the 3-day rate of change of the Value Line Composite relative to the standard deviation of the 30-day average. When the Value Line's 3-day rate of change have moved above 0.5 standard deviation of the 30-day average ROC, a "thrust" occurs and since 2000, the Value Line Composite has gained ground at a rate of +20.6% per year. When the indicator is below 0.5 standard deviation of the 30-day, the Value Line has lost ground at a rate of -10.0% per year. And when neutral, the Value Line has gained at a rate of +5.9% per year.
Volume Thrust Indicator Explained: This indicator uses NASDAQ volume data to indicate bullish and bearish conditions for the NASDAQ Composite Index. The indicator plots the ratio of the 10-day total of NASDAQ daily advancing volume (i.e., the total volume traded in stocks which rose in price each day) to the 10-day total of daily declining volume (volume traded in stocks which fell each day). This ratio indicates when advancing stocks are attracting the majority of the volume (readings above 1.0) and when declining stocks are seeing the heaviest trading (readings below 1.0). This indicator thus supports the case that a rising market supported by heavier volume in the advancing issues tends to be the most bullish condition, while a declining market with downside volume dominating confirms bearish conditions. When in a positive mode, the NASDAQ Composite has gained at a rate of +38.3% per year, When neutral, the NASDAQ has gained at a rate of +13.3% per year. And when negative, the NASDAQ has lost at a rate of -8.5% per year.
Breadth Thrust Indicator Explained: This indicator uses the number of NASDAQ-listed stocks advancing and declining to indicate bullish or bearish breadth conditions for the NASDAQ Composite. The indicator plots the ratio of the 10-day total of the number of stocks rising on the NASDAQ each day to the 10-day total of the number of stocks declining each day. Using 10-day totals smooths the random daily fluctuations and gives indications on an intermediate-term basis. As expected, the NASDAQ Composite performs much better when the 10-day A/D ratio is high (strong breadth) and worse when the indicator is in its lower mode (weak breadth). The most bullish conditions for the NASDAQ when the 10-day A/D indicator is not only high, but has recently posted an extreme high reading and thus indicated a thrust of upside momentum. Bearish conditions are confirmed when the indicator is low and has recently signaled a downside breadth thrust. In positive mode, the NASDAQ has gained at a rate of +22.1% per year since 1981. In a neutral mode, the NASDAQ has gained at a rate of +14.5% per year. And when in a negative mode, the NASDAQ has lost at a rate of -6.4% per year.
Bull/Bear Volume Relationship Explained: This indicator plots both "supply" and "demand" volume lines. When the Demand Volume line is above the Supply Volume line, the indicator is bullish. From 1981, the stock market has gained at an average annual rate of +11.7% per year when in a bullish mode. When the Demand Volume line is below the Supply Volume line, the indicator is bearish. When the indicator has been bearish, the market has lost ground at a rate of -6.1% per year.
Technical Health of 100 Industry Groups Explained: Designed to provide a reading on the technical health of the overall market, this indicator takes the technical temperature of more than 100 industry sectors each week. Looking back to early 1980, when the model is rated as "positive," the S&P has averaged returns in excess of 23% per year. When the model carries a "neutral" reading, the S&P has returned over 11% per year. But when the model is rated "negative," stocks fall by more than -13% a year on average.
Weekly State of the Market Model Reading Explained:Different market environments require different investing strategies. To help us identify the current environment, we look to our longer-term State of the Market Model. This model is designed to tell us when risk factors are high, low, or uncertain. In short, this longer-term oriented, weekly model tells us whether the odds favor the bulls, bears, or neither team.
Disclosures
The opinions and forecasts expressed herein are those of Mr. David Moenning and may not actually come to pass. Mr. Moenning's opinions and viewpoints regarding the future of the markets should not be construed as recommendations. The analysis and information in this report is for informational purposes only. No part of the material presented in this report is intended as an investment recommendation or investment advice. Neither the information nor any opinion expressed constitutes a solicitation to purchase or sell securities or any investment program.
Any investment decisions must in all cases be made by the reader or by his or her investment adviser. Do NOT ever purchase any security without doing sufficient research. There is no guarantee that the investment objectives outlined will actually come to pass. All opinions expressed herein are subject to change without notice. Neither the editor, employees, nor any of their affiliates shall have any liability for any loss sustained by anyone who has relied on the information provided.
The analysis provided is based on both technical and fundamental research and is provided "as is" without warranty of any kind, either expressed or implied. Although the information contained is derived from sources which are believed to be reliable, they cannot be guaranteed.
David D. Moenning is an investment adviser representative of Sowell Management Services, a registered investment advisor. For a complete description of investment risks, fees and services, review the firm brochure (ADV Part 2) which is available by contacting Sowell. Sowell is not registered as a broker-dealer.
Employees and affiliates of Sowell may at times have positions in the securities referred to and may make purchases or sales of these securities while publications are in circulation. Positions may change at any time.
Investments in equities carry an inherent element of risk including the potential for significant loss of principal. Past performance is not an indication of future results.
Advisory services are offered through Sowell Management Services.
Recent free content from FrontRange Trading Co.
-
 Is The Bull Argument Too Easy These Days?
— 8/31/20
Is The Bull Argument Too Easy These Days?
— 8/31/20
-
What Do The Cycles Say About 2020?
— 1/21/20
-
Modeling 2020 Expectations (Just For Fun)
— 1/13/20
-
Tips From Real-World Wendy Rhoades
— 5/06/19
-
The Best Recession Ever!
— 4/29/19
-
{[comment.author.username]} {[comment.author.username]} — Marketfy Staff — Maven — Member


- 1 Campus Martius, Suite #200Detroit, MI 48226
- +1 877 440 9464