

A Look At The Big Picture Indicators
Modern times demand modern thinking in portfolio design. Learn more...
With the markets having basically marked time yesterday, it provides us an opportunity to ignore the near-term gyrations and continue our look at what the big picture indicators may be telling us.
We concluded yesterday's review by surmising that the price and momentum indicators are in pretty good shape at the present time. However, we also talked about the idea that these indicators have been "fooled" on a regular basis for the better part of the last two year. As such, I concluded that we should take a longer/deeper look at both our external factor models/indicators and our primary cycle models.
Let's start with what I call the external factor indicators. But first a caveat...
When looking at this group of models, we need to recognize that these are definitely NOT timing indicators. In fact, they are pretty awful in terms of calling the near-term action. Again, the objective of these models is to give us a feel for which team has the odds on their side from a big picture standpoint.
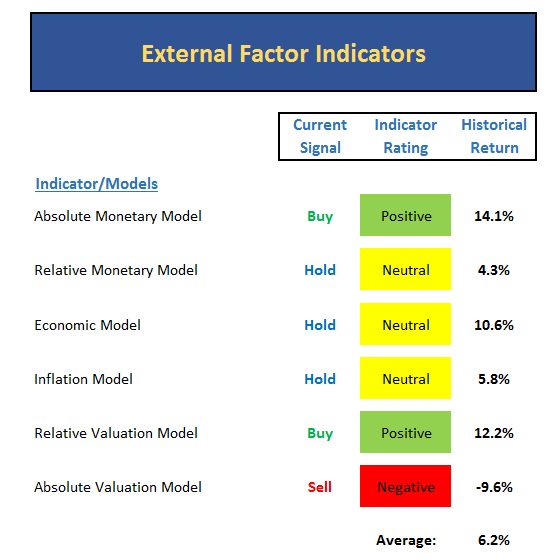
So let's see, in this group there are two green boxes, three yellow boxes and a red box (which effectively turns the valuation component to neutral). The quick and dirty takeaway then is this... Can you say neutral?
Digging in a little, we see that the monetary situation remains moderately positive due to the fact that rates remain at historic lows and are unlikely to move significantly higher any time soon. However, if the Fed starts to talk about raising rates more than twice more in 2016, stocks could easily start to struggle.
The next area of concern is the economic model. While still neutral, the reading of the model has continued to drop recently. This does NOT suggest that a recession is likely - far from it. However, I would be remiss if I didn't mention that this model no longer favors the bulls.
The same story is being told from the inflation model. While there does not appear to be runaway inflation on the horizon, there are wage pressures building. And it is important to remember that wage inflation (which, of course, is a good thing for workers) is the real worry from an inflationary standpoint. But at this stage of the game, the indicator is neutral - and again, no longer a plus in the bull camp's ledger.
As for valuations, I'll try to find time to highlight the details of this complex issue soon. But cutting to the chase, the bear market has NOT caused valuations to improve. The problem is that while prices have fallen, so too have earnings. And in fact, our median price-to-earnings indicator actually rose last month. As such, this category can be rated as no better than neutral right now. In other words, the positives of low rates are being offset by the levels of the key indicators such as P/E, P/D, P/B, etc.
The Big Picture Cycle...
Finally, let's take a look at my favorite, longer-term models that are designed to give us a sense of the state of the market's primary cycle.

Running through this set I see that the tape is currently constructive, the risk/reward model is neutral, the external factors model (monetary, economic, valuation, and sentiment) is positive, but our Leading Indicators Model is negative. Therefore, I'd rate this bunch as either high neutral or at the low end of the moderately positive spectrum.
The takeaway here is that crosscurrents remain entrenched in this market. In short, you can apply a "yea, but" to just about all of the arguments from both sides of the aisle. And when you do the math on the various indicator modes in this set, you get an average annualized rate of return of 6.4%, which is below the historical average.
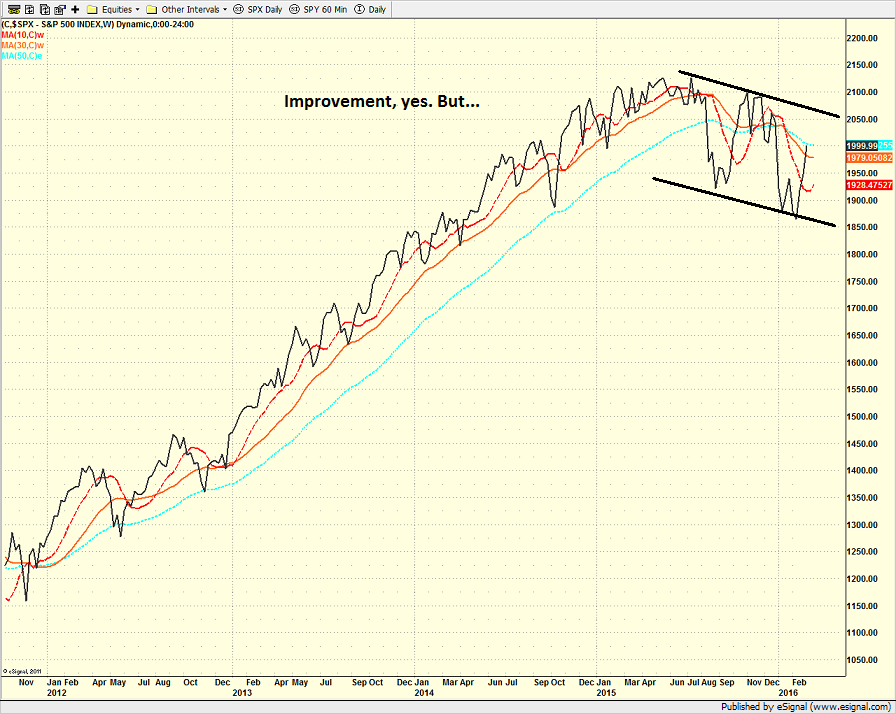
Then when one looks at the weekly chart of the S&P 500, it is clear that while the bulls could certainly change the game with another few weeks of strong gains, the trend remains negative at this time.
S&P 500 - Weekly 
View Larger Image
In summary, I come up with the following conclusions:
- The near-term action is promising
- Stocks are overbought and nearing resistance, which means a pullback is likely
- From a longer-term point of view, stocks remain in a downtrend
- The external factors are neutral
- Valuations remain elevated
- Interest rates are low
- Inflation is low but edging higher
- The economy has weakened a bit
- Our primary cycle indicators aren't bearish, but they aren't completely bullish either
For me then, the bottom line is that while the bulls can certainly continue their run, a short-term pullback is to be expected. From there, the onus will be on the bulls to prove that the recent bounce is something more than a countertrend rally within the context of an ongoing bear market. Thus, the action in the coming days would appear to be relatively important - especially with the ECB on tap.
Turning to This Morning
China is in focus again this morning along with a big rebound in Germany's industrial production and a call out of Goldman that the commodity rally is not sustainable. In China, exports fell 25.4% on a year-over-year basis, which was much worse than the consensus expectations. In Germany, industrial production increased 3.3% in January, which was about 6X the expectated result. And here at home, Goldman Sachs says that the recent bounce in commodities may have gone too far too fast given the macro backdrop. Overnight markets are mostly weaker and U.S. futures once again point to a lower open on Wall Street. However we should note that the intraday dips have been bought in the last couple weeks so it will be interesting to see if this trend continues today.
Today's Pre-Game Indicators
Here are the Pre-Market indicators we review each morning before the opening bell...
Major Foreign Markets:
Japan: -0.76%
Hong Kong: -0.73%
Shanghai: +0.14%
London: -0.40%
Germany: -0.27%
France: -0.58%
Italy: +0.27%
Spain: +0.26%
Crude Oil Futures: -$0.04 to $37.86
Gold: +$10.90 at $1275.10
Dollar: higher against the yen and pound, lower vs. euro
10-Year Bond Yield: Currently trading at 1.852%
Stock Indices in U.S. (relative to fair value):
S&P 500: -9.50
Dow Jones Industrial Average: -59
NASDAQ Composite: -22.20
Thought For The Day:
"It is never too late to be what you might have been." -George Eliot
Here's wishing you green screens and all the best for a great day,

David D. Moenning
Founder: Heritage Capital Research
Chief Investment Officer: Sowell Management Services
Looking for More on the State of the Markets?
!function(d,s,id){var js,fjs=d.getElementsByTagName(s)[0],p=/^http:/.test(d.location)?'http':'https';if(!d.getElementById(id)){js=d.createElement(s);js.id=id;js.src=p+'://platform.twitter.com/widgets.js';fjs.parentNode.insertBefore(js,fjs);}}(document, 'script', 'twitter-wjs');Current Market Drivers
We strive to identify the driving forces behind the market action on a daily basis. The thinking is that if we can both identify and understand why stocks are doing what they are doing on a short-term basis; we are not likely to be surprised/blind-sided by a big move. Listed below are what we believe to be the driving forces of the current market (Listed in order of importance).
1. The State of the Oil Crisis
2. The State of Global Central Bank Policy
3. The State of the Stock Market Valuations
4. The State of Global Growth
The State of the Trend
We believe it is important to analyze the market using multiple time-frames. We define short-term as 3 days to 3 weeks, intermediate-term as 3 weeks to 6 months, and long-term as 6 months or more. Below are our current ratings of the three primary trends:
Short-Term Trend (1 - 3 Weeks): Positive
(Chart below is S&P 500 daily over past 1 month)
Intermediate-Term Trend (1 - 6 Months): Neutral
(Chart below is S&P 500 daily over past 6 months)
Long-Term Trend (6 - 18 Months): Moderately Negative
(Chart below is S&P 500 daily over past 2 years)
Key Technical Areas:
Traders as well as computerized algorithms are generally keenly aware of the important technical levels on the charts from a short-term basis. Below are the levels we deem important to watch today:
- Key Near-Term Support Zone(s) for S&P 500: 1950(ish)
- Key Near-Term Resistance Zone(s): 2000-2020
The State of the Tape
Momentum indicators are designed to tell us about the technical health of a trend - I.E. if there is any "oomph" behind the move. Below are a handful of our favorite indicators relating to the market's "mo"...
- Trend and Breadth Confirmation Indicator (Short-Term): Positive
- Price Thrust Indicator: Positive
- Volume Thrust Indicator(NASDAQ): Positive
- Breadth Thrust Indicator (NASDAQ): Positive
- Short-Term Volume Relationship: Positive
- Technical Health of 100+ Industry Groups: Moderately Positive
The Early Warning Indicators
Markets travel in cycles. Thus we must constantly be on the lookout for changes in the direction of the trend. Looking at market sentiment and the overbought/sold conditions can provide "early warning signs" that a trend change may be near.
- S&P 500 Overbought/Oversold Conditions:
- Short-Term: Overbought
- Intermediate-Term: Neutral
- Market Sentiment: Our primary sentiment model is Neutral
The State of the Market Environment
One of the keys to long-term success in the stock market is stay in tune with the market's "big picture" environment in terms of risk versus reward.
- Weekly Market Environment Model Reading: Neutral
Indicator Explanations
Trend and Breadth Confirmation Indicator (Short-Term) Explained: History shows the most reliable market moves tend to occur when the breadth indices are in gear with the major market averages. When the breadth measures diverge, investors should take note that a trend reversal may be at hand. This indicator incorporates an All-Cap Dollar Weighted Equity Series and A/D Line. From 1998, when the A/D line is above its 5-day smoothing and the All-Cap Equal Weighted Equity Series is above its 25-day smoothing, the equity index has gained at a rate of +32.5% per year. When one of the indicators is above its smoothing, the equity index has gained at a rate of +13.3% per year. And when both are below, the equity index has lost +23.6% per year.
Price Thrust Indicator Explained: This indicator measures the 3-day rate of change of the Value Line Composite relative to the standard deviation of the 30-day average. When the Value Line's 3-day rate of change have moved above 0.5 standard deviation of the 30-day average ROC, a "thrust" occurs and since 2000, the Value Line Composite has gained ground at a rate of +20.6% per year. When the indicator is below 0.5 standard deviation of the 30-day, the Value Line has lost ground at a rate of -10.0% per year. And when neutral, the Value Line has gained at a rate of +5.9% per year.
Volume Thrust Indicator Explained: This indicator uses NASDAQ volume data to indicate bullish and bearish conditions for the NASDAQ Composite Index. The indicator plots the ratio of the 10-day total of NASDAQ daily advancing volume (i.e., the total volume traded in stocks which rose in price each day) to the 10-day total of daily declining volume (volume traded in stocks which fell each day). This ratio indicates when advancing stocks are attracting the majority of the volume (readings above 1.0) and when declining stocks are seeing the heaviest trading (readings below 1.0). This indicator thus supports the case that a rising market supported by heavier volume in the advancing issues tends to be the most bullish condition, while a declining market with downside volume dominating confirms bearish conditions. When in a positive mode, the NASDAQ Composite has gained at a rate of +38.3% per year, When neutral, the NASDAQ has gained at a rate of +13.3% per year. And when negative, the NASDAQ has lost at a rate of -8.5% per year.
Breadth Thrust Indicator Explained: This indicator uses the number of NASDAQ-listed stocks advancing and declining to indicate bullish or bearish breadth conditions for the NASDAQ Composite. The indicator plots the ratio of the 10-day total of the number of stocks rising on the NASDAQ each day to the 10-day total of the number of stocks declining each day. Using 10-day totals smooths the random daily fluctuations and gives indications on an intermediate-term basis. As expected, the NASDAQ Composite performs much better when the 10-day A/D ratio is high (strong breadth) and worse when the indicator is in its lower mode (weak breadth). The most bullish conditions for the NASDAQ when the 10-day A/D indicator is not only high, but has recently posted an extreme high reading and thus indicated a thrust of upside momentum. Bearish conditions are confirmed when the indicator is low and has recently signaled a downside breadth thrust. In positive mode, the NASDAQ has gained at a rate of +22.1% per year since 1981. In a neutral mode, the NASDAQ has gained at a rate of +14.5% per year. And when in a negative mode, the NASDAQ has lost at a rate of -6.4% per year.
Bull/Bear Volume Relationship Explained: This indicator plots both "supply" and "demand" volume lines. When the Demand Volume line is above the Supply Volume line, the indicator is bullish. From 1981, the stock market has gained at an average annual rate of +11.7% per year when in a bullish mode. When the Demand Volume line is below the Supply Volume line, the indicator is bearish. When the indicator has been bearish, the market has lost ground at a rate of -6.1% per year.
Technical Health of 100 Industry Groups Explained: Designed to provide a reading on the technical health of the overall market, this indicator takes the technical temperature of more than 100 industry sectors each week. Looking back to early 1980, when the model is rated as "positive," the S&P has averaged returns in excess of 23% per year. When the model carries a "neutral" reading, the S&P has returned over 11% per year. But when the model is rated "negative," stocks fall by more than -13% a year on average.
Weekly State of the Market Model Reading Explained:Different market environments require different investing strategies. To help us identify the current environment, we look to our longer-term State of the Market Model. This model is designed to tell us when risk factors are high, low, or uncertain. In short, this longer-term oriented, weekly model tells us whether the odds favor the bulls, bears, or neither team.
Disclosures
The opinions and forecasts expressed herein are those of Mr. David Moenning and may not actually come to pass. Mr. Moenning's opinions and viewpoints regarding the future of the markets should not be construed as recommendations. The analysis and information in this report is for informational purposes only. No part of the material presented in this report is intended as an investment recommendation or investment advice. Neither the information nor any opinion expressed constitutes a solicitation to purchase or sell securities or any investment program.
Any investment decisions must in all cases be made by the reader or by his or her investment adviser. Do NOT ever purchase any security without doing sufficient research. There is no guarantee that the investment objectives outlined will actually come to pass. All opinions expressed herein are subject to change without notice. Neither the editor, employees, nor any of their affiliates shall have any liability for any loss sustained by anyone who has relied on the information provided.
The analysis provided is based on both technical and fundamental research and is provided "as is" without warranty of any kind, either expressed or implied. Although the information contained is derived from sources which are believed to be reliable, they cannot be guaranteed.
David D. Moenning is an investment adviser representative of Sowell Management Services, a registered investment advisor. For a complete description of investment risks, fees and services, review the firm brochure (ADV Part 2) which is available by contacting Sowell. Sowell is not registered as a broker-dealer.
Employees and affiliates of Sowell may at times have positions in the securities referred to and may make purchases or sales of these securities while publications are in circulation. Positions may change at any time.
Investments in equities carry an inherent element of risk including the potential for significant loss of principal. Past performance is not an indication of future results.
Advisory services are offered through Sowell Management Services.
Recent free content from FrontRange Trading Co.
-
 Is The Bull Argument Too Easy These Days?
— 8/31/20
Is The Bull Argument Too Easy These Days?
— 8/31/20
-
What Do The Cycles Say About 2020?
— 1/21/20
-
Modeling 2020 Expectations (Just For Fun)
— 1/13/20
-
Tips From Real-World Wendy Rhoades
— 5/06/19
-
The Best Recession Ever!
— 4/29/19
-
{[comment.author.username]} {[comment.author.username]} — Marketfy Staff — Maven — Member


- 1 Campus Martius, Suite #200Detroit, MI 48226
- +1 877 440 9464