

Has FOMO Returned?
Wanna know what happens when all the fast-money types get fooled at the exact same time? Yep, that's right; a short-covering/risk-on/hysterical panic on the first day of March, that's what.
I am often amused by those who feel compelled to call/email/text to tell me with absolute certainty what Ms. Market is about to do next. And after Monday's "failure" at a key resistance, I received a handful of notes and a couple of calls suggesting that I'd best get on the short side of the stock market in a big hurry - because clearly the bears were about to resume their attack.
"It's obvious," I was told. "The oversold rally failed and a reversal is underway. You need to get positioned for a 1,000 point decline on the DJIA - it's a no brainer," they said.
The really humorous part about all of this is the fact that I never have and likely never will play the fast-money trading game. I don't do it for myself and I would never dream of doing it for clients and/or the financial advisors I serve. But that's beside the point, I guess. There are just some folks who can't resist the opportunity to predict the future in a rather loud fashion.
To be sure, the Dow's 348 point or 2.1% spike higher on Tuesday (which was the worst return of the major indices on a percentage basis) caught a lot of folks by surprise. As such, the news that NY Fed President Dudley started walking back the idea of hiking rates early and often in 2016, the ongoing expectation of more "policy support" from the Chinese, the continued ramp up in expectations for the ECB to expand their QE game next week, and the seemingly never ending speculation of more stimulus in Japan all appeared to cause the masters of the universe to reverse course - in a hurry.
So, with prices moving higher throughout the day and breaking all kinds of technical levels in the process, the talk of the end of the world, which had been prevalent less than 24 hours earlier, was replaced by optimism about Ford's auto sales, the better than expected home sales numbers and a rebound in the ISM Manufacturing Index. Yes fans, good news appears to be good news again - well for now, anyway.
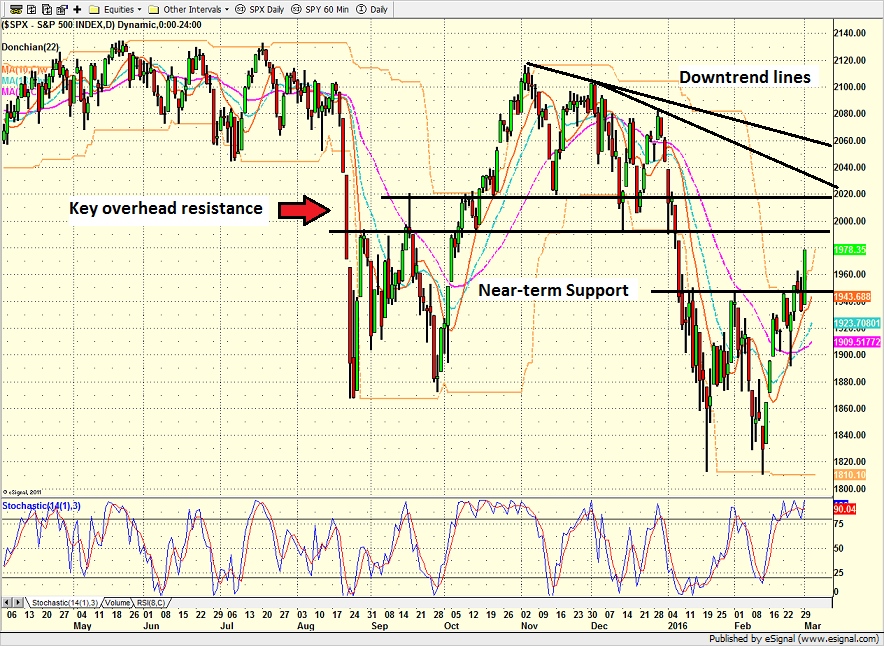
On a chart basis, yesterday's run for the border was actually pretty impressive. I've drawn in some of the key lines in the sand on the chart below for your general entertainment.
S&P 500 - Daily 
View Larger Image
So, now the chartists are talking about the upside targets from the double-bottom, the key moving averages and Fibonacci retracement levels, which all seem to converge somewhere in the 2000 - 2020 level on the S&P 500. And if the anticipated oil production cut talks run into any kind of snag in the near-term, the thinking is that those resistance zones could easily come into play.
On the oil front, it is worth noting that oil hit a two-month high yesterday. West Texas Intermediate crude settled up another 1.9% to $34.40 a barrel. Apparently Russian President Putin said yesterday that his Energy Minister Novak had agreed on most of the key aspects of the deal with OPEC producers. The minister himself said that even without Iran, the deal will be effective. However, he also floated the idea of providing an exemption for Iran to allow it to boost production from depressed levels. (What could possibly go wrong here?)
But again, the key is to understand that the price of oil remains a proxy for the state of entire crisis. The assumption is that if oil rises, the risk of contagion to other areas - especially the banks - falls. Thus, it wasn't surprising to see the BKX lift 4.6% and the likes of CS and DB get up off the mat yesterday.
The question, of course, is how long the optimism will last. Maybe the bulls are right. Maybe the lows are in. And just like last October, maybe stocks will march merrily higher until somebody notices that earnings have fallen for two consecutive quarters, sales have declined for four straight quarters, and that valuations haven't improved during the bear market decline. But, that's a story for another day - today the focus is about rockin' on.
In an effort to keep it real, I wanted to check in with my weekly charts - just to see if anything had changed after the market's raucous ride.
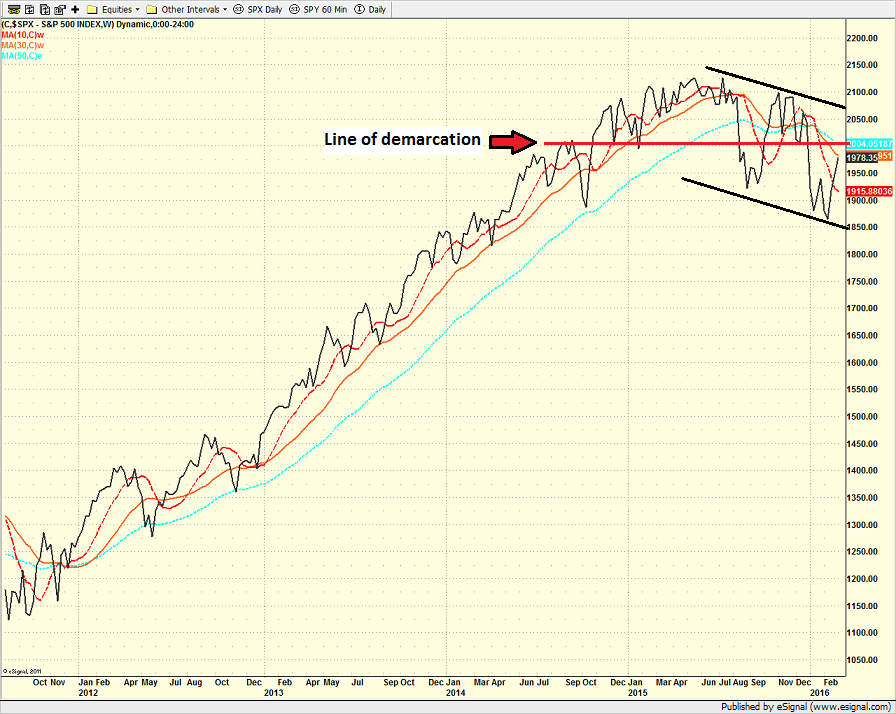
S&P 500 - Weekly 
View Larger Image
While I'm of the opinion that chart watching loses value almost on a daily basis these days, my simple-minded takeaway is that the downtrend remains intact and that the key line of demarcation lies ahead around 2005ish. From my perch, a meaningful break of this area on a weekly chart would seem to give the bulls a shot at assaulting the downtrend line - a line that currently sits around 2050.
The bottom line is that the mood appears to have shifted at the corner of Broad and Wall. Now the fast-money types are running around with their hair on fire telling us that everything in the market is all better now. What a difference a day makes, eh?
But with more global central bank intervention on the way and traders remembering the way the bear markets ended in 2009 and 2011, apparently no one wants to miss out. Thus, the phrase of the day may quickly become F.O.M.O. (fear of missing out). Stay tuned...
Turning to This Morning
With a risk-on mentality taking hold, it was not surprising to see stocks soar overnight in Asia as stocks in Japan and China gained more than 4%. The big gains came in spite of Moody's downgrade of China's credit rating outlook from negative from stable. Moody's cited ongoing and prospective weakening of fiscal metrics, such as rising government debt and continuing capital outflows. However, things are a bit more sanguine here at home this morning as oil is moving the wrong direction again. Reports of larger than expected inventories from both API and Cushing are to blame. As such, stock futures are pointing to a mixed open on Wall Street.
Today's Pre-Game Indicators
Here are the Pre-Market indicators we review each morning before the opening bell...
Major Foreign Markets:
Japan: +4.11%
Hong Kong: +3.07%
Shanghai: +4.27%
London: -0.36%
Germany: +0.37%
France: +0.14%
Italy: +0.87%
Spain: +1.29%
Crude Oil Futures: -$0.48 to $33.94
Gold: +$3.50 at $1234.00
Dollar: lower against the yen, euro and pound
10-Year Bond Yield: Currently trading at 1.837%
Stock Indices in U.S. (relative to fair value):
S&P 500: -2.75
Dow Jones Industrial Average: -35
NASDAQ Composite: +2.25
Thought For The Day:
An inch of time cannot be bought with an inch of gold -- Chinese Proverb
Here's wishing you green screens and all the best for a great day,

David D. Moenning
Founder and Chief Investment Strategist
Heritage Capital Research
Looking for a "Modern" approach to Asset Allocation and Portfolio Design?
Would you like help developing a custom designed portfolio?
Looking for More on the State of the Markets?
Current Market Drivers
We strive to identify the driving forces behind the market action on a daily basis. The thinking is that if we can both identify and understand why stocks are doing what they are doing on a short-term basis; we are not likely to be surprised/blind-sided by a big move. Listed below are what we believe to be the driving forces of the current market (Listed in order of importance).
1. The State of the Oil Crisis
2. The State of Global Central Bank Policy
3. The State of the Stock Market Valuations
4. The State of Global Growth
The State of the Trend
We believe it is important to analyze the market using multiple time-frames. We define short-term as 3 days to 3 weeks, intermediate-term as 3 weeks to 6 months, and long-term as 6 months or more. Below are our current ratings of the three primary trends:
Short-Term Trend (1 - 3 Weeks): Positive
(Chart below is S&P 500 daily over past 1 month)
Intermediate-Term Trend (1 - 6 Months): Moderately Negative
(Chart below is S&P 500 daily over past 6 months)
Long-Term Trend (6 - 18 Months): Moderately Negative
(Chart below is S&P 500 daily over past 2 years)
Key Technical Areas:
Traders as well as computerized algorithms are generally keenly aware of the important technical levels on the charts from a short-term basis. Below are the levels we deem important to watch today:
- Key Near-Term Support Zone(s) for S&P 500: 1905
- Key Near-Term Resistance Zone(s): 1945-1960
The State of the Tape
Momentum indicators are designed to tell us about the technical health of a trend - I.E. if there is any "oomph" behind the move. Below are a handful of our favorite indicators relating to the market's "mo"...
- Trend and Breadth Confirmation Indicator (Short-Term): Positive
- Price Thrust Indicator: Positive
- Volume Thrust Indicator(NASDAQ): Positive
- Breadth Thrust Indicator (NASDAQ): Positive
- Short-Term Volume Relationship: Moderately Positive
- Technical Health of 100+ Industry Groups: Neutal
The Early Warning Indicators
Markets travel in cycles. Thus we must constantly be on the lookout for changes in the direction of the trend. Looking at market sentiment and the overbought/sold conditions can provide "early warning signs" that a trend change may be near.
- S&P 500 Overbought/Oversold Conditions:
- Short-Term: Overbought
- Intermediate-Term: Moderately Oversold
- Market Sentiment: Our primary sentiment model is Neutral
The State of the Market Environment
One of the keys to long-term success in the stock market is stay in tune with the market's "big picture" environment in terms of risk versus reward.
- Weekly Market Environment Model Reading: Neutral
Indicator Explanations
Trend and Breadth Confirmation Indicator (Short-Term) Explained: History shows the most reliable market moves tend to occur when the breadth indices are in gear with the major market averages. When the breadth measures diverge, investors should take note that a trend reversal may be at hand. This indicator incorporates an All-Cap Dollar Weighted Equity Series and A/D Line. From 1998, when the A/D line is above its 5-day smoothing and the All-Cap Equal Weighted Equity Series is above its 25-day smoothing, the equity index has gained at a rate of +32.5% per year. When one of the indicators is above its smoothing, the equity index has gained at a rate of +13.3% per year. And when both are below, the equity index has lost +23.6% per year.
Price Thrust Indicator Explained: This indicator measures the 3-day rate of change of the Value Line Composite relative to the standard deviation of the 30-day average. When the Value Line's 3-day rate of change have moved above 0.5 standard deviation of the 30-day average ROC, a "thrust" occurs and since 2000, the Value Line Composite has gained ground at a rate of +20.6% per year. When the indicator is below 0.5 standard deviation of the 30-day, the Value Line has lost ground at a rate of -10.0% per year. And when neutral, the Value Line has gained at a rate of +5.9% per year.
Volume Thrust Indicator Explained: This indicator uses NASDAQ volume data to indicate bullish and bearish conditions for the NASDAQ Composite Index. The indicator plots the ratio of the 10-day total of NASDAQ daily advancing volume (i.e., the total volume traded in stocks which rose in price each day) to the 10-day total of daily declining volume (volume traded in stocks which fell each day). This ratio indicates when advancing stocks are attracting the majority of the volume (readings above 1.0) and when declining stocks are seeing the heaviest trading (readings below 1.0). This indicator thus supports the case that a rising market supported by heavier volume in the advancing issues tends to be the most bullish condition, while a declining market with downside volume dominating confirms bearish conditions. When in a positive mode, the NASDAQ Composite has gained at a rate of +38.3% per year, When neutral, the NASDAQ has gained at a rate of +13.3% per year. And when negative, the NASDAQ has lost at a rate of -8.5% per year.
Breadth Thrust Indicator Explained: This indicator uses the number of NASDAQ-listed stocks advancing and declining to indicate bullish or bearish breadth conditions for the NASDAQ Composite. The indicator plots the ratio of the 10-day total of the number of stocks rising on the NASDAQ each day to the 10-day total of the number of stocks declining each day. Using 10-day totals smooths the random daily fluctuations and gives indications on an intermediate-term basis. As expected, the NASDAQ Composite performs much better when the 10-day A/D ratio is high (strong breadth) and worse when the indicator is in its lower mode (weak breadth). The most bullish conditions for the NASDAQ when the 10-day A/D indicator is not only high, but has recently posted an extreme high reading and thus indicated a thrust of upside momentum. Bearish conditions are confirmed when the indicator is low and has recently signaled a downside breadth thrust. In positive mode, the NASDAQ has gained at a rate of +22.1% per year since 1981. In a neutral mode, the NASDAQ has gained at a rate of +14.5% per year. And when in a negative mode, the NASDAQ has lost at a rate of -6.4% per year.
Bull/Bear Volume Relationship Explained: This indicator plots both "supply" and "demand" volume lines. When the Demand Volume line is above the Supply Volume line, the indicator is bullish. From 1981, the stock market has gained at an average annual rate of +11.7% per year when in a bullish mode. When the Demand Volume line is below the Supply Volume line, the indicator is bearish. When the indicator has been bearish, the market has lost ground at a rate of -6.1% per year.
Technical Health of 100 Industry Groups Explained: Designed to provide a reading on the technical health of the overall market, this indicator takes the technical temperature of more than 100 industry sectors each week. Looking back to early 1980, when the model is rated as "positive," the S&P has averaged returns in excess of 23% per year. When the model carries a "neutral" reading, the S&P has returned over 11% per year. But when the model is rated "negative," stocks fall by more than -13% a year on average.
Weekly State of the Market Model Reading Explained:Different market environments require different investing strategies. To help us identify the current environment, we look to our longer-term State of the Market Model. This model is designed to tell us when risk factors are high, low, or uncertain. In short, this longer-term oriented, weekly model tells us whether the odds favor the bulls, bears, or neither team.
Disclosures
The opinions and forecasts expressed herein are those of Mr. David Moenning and may not actually come to pass. Mr. Moenning's opinions and viewpoints regarding the future of the markets should not be construed as recommendations. The analysis and information in this report is for informational purposes only. No part of the material presented in this report is intended as an investment recommendation or investment advice. Neither the information nor any opinion expressed constitutes a solicitation to purchase or sell securities or any investment program.
Any investment decisions must in all cases be made by the reader or by his or her investment adviser. Do NOT ever purchase any security without doing sufficient research. There is no guarantee that the investment objectives outlined will actually come to pass. All opinions expressed herein are subject to change without notice. Neither the editor, employees, nor any of their affiliates shall have any liability for any loss sustained by anyone who has relied on the information provided.
The analysis provided is based on both technical and fundamental research and is provided "as is" without warranty of any kind, either expressed or implied. Although the information contained is derived from sources which are believed to be reliable, they cannot be guaranteed.
David D. Moenning is an investment adviser representative of Sowell Management Services, a registered investment advisor. For a complete description of investment risks, fees and services, review the firm brochure (ADV Part 2) which is available by contacting Sowell. Sowell is not registered as a broker-dealer.
Employees and affiliates of Sowell may at times have positions in the securities referred to and may make purchases or sales of these securities while publications are in circulation. Positions may change at any time.
Investments in equities carry an inherent element of risk including the potential for significant loss of principal. Past performance is not an indication of future results.
Advisory services are offered through Sowell Management Services.
Recent free content from FrontRange Trading Co.
-
 Is The Bull Argument Too Easy These Days?
— 8/31/20
Is The Bull Argument Too Easy These Days?
— 8/31/20
-
What Do The Cycles Say About 2020?
— 1/21/20
-
Modeling 2020 Expectations (Just For Fun)
— 1/13/20
-
Tips From Real-World Wendy Rhoades
— 5/06/19
-
The Best Recession Ever!
— 4/29/19
-
{[comment.author.username]} {[comment.author.username]} — Marketfy Staff — Maven — Member


- 1 Campus Martius, Suite #200Detroit, MI 48226
- +1 877 440 9464