

Near Term Action is Key
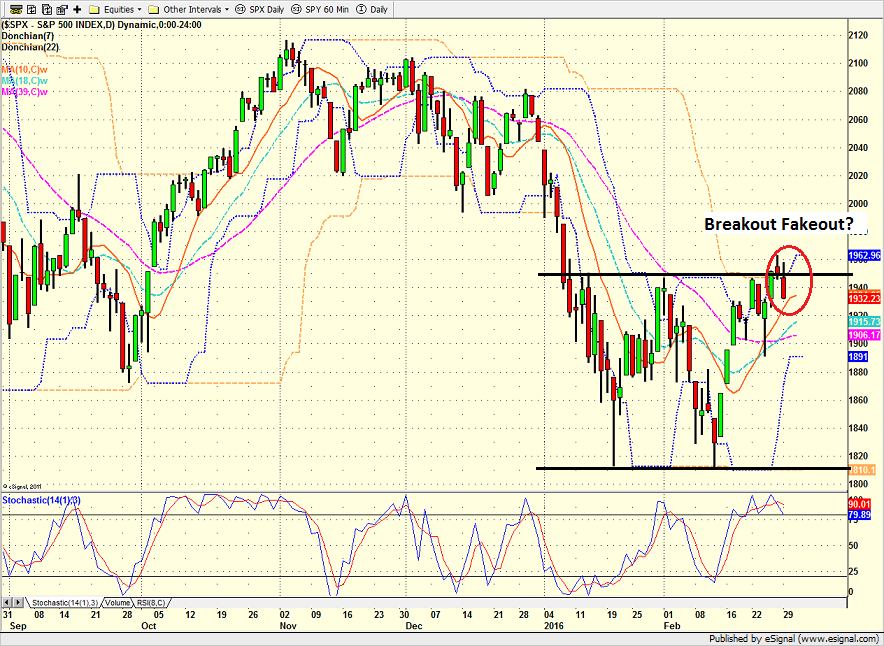
Although there continues to be a great many moving parts in this market, the key to the near-term would appear to be the price action. Cutting to the chase, the question of the day is if the recent break to the upside, which would seem to argue for higher prices ahead, has turned into the latest "breakout fakeout."
At this time yesterday, it looked like the bulls were in pretty good shape. While the futures were a little sloppy, the action on the daily chart of the S&P 500 suggested that the bulls were in charge. However, after an initial rally on Leap Day 2016, it was all downhill into the close. And before you could confirm whether "fakeout" was technically one word or two, the venerable blue chip index had retreated into the trading range.
S&P 500 - Daily 
View Larger Image
What is interesting here is that the usual drivers of the action weren't present yesterday. Oil rose. High Yields were up. This despite the fact that bond yields fell and the dollar continued to move higher.
The move in the government bond market makes some sense as the economic data we saw yesterday was surprisingly soft. And while there are still no signs of recession in the good ol' USofA, the manufacturing sector continues to weaken.
On the dollar front, the surprise move by the PBoC to cut rates was likely behind the move higher. But what was interesting is that both the greenback and oil have been moving higher of late, which, of course, isn't supposed to happen. Thus, the action yesterday caused some head scratching.
Bulls Aren't Out of It Just Yet
While the bears contends that yesterday's reversal suggests that the recent rally has ended, we wouldn't be so fast to jump into the glass-is-half-empty camp just yet. You see, Ms. Market has a propensity to fool the masses - especially at the end of the month/quarter, and especially when a "technical move" is obvious.
Sure, if stocks move down from here, most technicians will be quick to call for another test of the 1810 lows. However, if the bulls can find a way to reverse the Friday/Monday move, then the retracement measurements will be front and center once again and talk of upside targets can resume.
We should also keep in mind that intervention by the globe's central bankers have kept all declines short and shallow recently. And with China taking action, Super Mario on deck, and Yellen's gang likely to start walking back talk of more rate hikes in 2016, one has to wonder why this time is going to be any different.
But the bottom line is if the bulls want to stay in the game, they have a limited amount of time to do so. So stay tuned, this could get interesting.
Turning to This Morning
The screens are sporting a nice shade of green in the overnight session. While the PMI data in China was disappointing (the official manufacturing PMI for February came in at 49.0 vs. 49.4 in January) hope for additional stimulative measures appears to continue to be a driving force. This theme continued in Europe as PMI's weakened in February but stock markets are higher across the continent. Here at home, NY Fed President Dudley said the balance of risks to growth and inflation have started to tilt to the downside. Dudley said he is somewhat less confident than he was before and noted that tighter financial conditions abroad are spilling back into the US economy and policy makers must take this into account in their assessment of appropriate monetary policy. U.S. stock futures are pointing to a strong open, which could easily reverse the Friday/Monday pullback.
Today's Pre-Game Indicators
Here are the Pre-Market indicators we review each morning before the opening bell...
Major Foreign Markets:
Japan: +0.37%
Hong Kong: +1.54%
Shanghai: +1.67%
London: +0.79%
Germany: +1.58%
France: +0.72%
Italy: +1.65%
Spain: +1.15%
Crude Oil Futures: +$0.63 to $34.38
Gold: +$1.60 at $1246.00
Dollar: lower against the yen, euro and pound
10-Year Bond Yield: Currently trading at 1.753%
Stock Indices in U.S. (relative to fair value):
S&P 500: +15.80
Dow Jones Industrial Average: +127
NASDAQ Composite: +32.50
Thought For The Day:
Choose a job you love, and you will never work a day in your life -Confucius
Here's wishing you green screens and all the best for a great day,

David D. Moenning
Founder and Chief Investment Strategist
Heritage Capital Research
Looking for a "Modern" approach to Asset Allocation and Portfolio Design?
Would you like help developing a custom designed portfolio?
Looking for More on the State of the Markets?
Looking to modernize your asset allocations, add risk management to client portfolios, or outsource portfolio design? Contact Eric@SowellManagement.com
Current Market Drivers
We strive to identify the driving forces behind the market action on a daily basis. The thinking is that if we can both identify and understand why stocks are doing what they are doing on a short-term basis; we are not likely to be surprised/blind-sided by a big move. Listed below are what we believe to be the driving forces of the current market (Listed in order of importance).
1. The State of the Oil Crisis
2. The State of Global Central Bank Policy
3. The State of the Stock Market Valuations
4. The State of Global Growth
The State of the Trend
We believe it is important to analyze the market using multiple time-frames. We define short-term as 3 days to 3 weeks, intermediate-term as 3 weeks to 6 months, and long-term as 6 months or more. Below are our current ratings of the three primary trends:
Short-Term Trend (1 - 3 Weeks): Positive
(Chart below is S&P 500 daily over past 1 month)
Intermediate-Term Trend (1 - 6 Months): Moderately Negative
(Chart below is S&P 500 daily over past 6 months)
Long-Term Trend (6 - 18 Months): Moderately Negative
(Chart below is S&P 500 daily over past 2 years)
Key Technical Areas:
Traders as well as computerized algorithms are generally keenly aware of the important technical levels on the charts from a short-term basis. Below are the levels we deem important to watch today:
- Key Near-Term Support Zone(s) for S&P 500: 1905
- Key Near-Term Resistance Zone(s): 1945-1960
The State of the Tape
Momentum indicators are designed to tell us about the technical health of a trend - I.E. if there is any "oomph" behind the move. Below are a handful of our favorite indicators relating to the market's "mo"...
- Trend and Breadth Confirmation Indicator (Short-Term): Positive
- Price Thrust Indicator: Positive
- Volume Thrust Indicator(NASDAQ): Positive
- Breadth Thrust Indicator (NASDAQ): Positive
- Short-Term Volume Relationship: Moderately Positive
- Technical Health of 100+ Industry Groups: Neutal
The Early Warning Indicators
Markets travel in cycles. Thus we must constantly be on the lookout for changes in the direction of the trend. Looking at market sentiment and the overbought/sold conditions can provide "early warning signs" that a trend change may be near.
- S&P 500 Overbought/Oversold Conditions:
- Short-Term: Neutral
- Intermediate-Term: Moderately Oversold
- Market Sentiment: Our primary sentiment model is Neutral
The State of the Market Environment
One of the keys to long-term success in the stock market is stay in tune with the market's "big picture" environment in terms of risk versus reward.
- Weekly Market Environment Model Reading: Neutral
Indicator Explanations
Trend and Breadth Confirmation Indicator (Short-Term) Explained: History shows the most reliable market moves tend to occur when the breadth indices are in gear with the major market averages. When the breadth measures diverge, investors should take note that a trend reversal may be at hand. This indicator incorporates an All-Cap Dollar Weighted Equity Series and A/D Line. From 1998, when the A/D line is above its 5-day smoothing and the All-Cap Equal Weighted Equity Series is above its 25-day smoothing, the equity index has gained at a rate of +32.5% per year. When one of the indicators is above its smoothing, the equity index has gained at a rate of +13.3% per year. And when both are below, the equity index has lost +23.6% per year.
Price Thrust Indicator Explained: This indicator measures the 3-day rate of change of the Value Line Composite relative to the standard deviation of the 30-day average. When the Value Line's 3-day rate of change have moved above 0.5 standard deviation of the 30-day average ROC, a "thrust" occurs and since 2000, the Value Line Composite has gained ground at a rate of +20.6% per year. When the indicator is below 0.5 standard deviation of the 30-day, the Value Line has lost ground at a rate of -10.0% per year. And when neutral, the Value Line has gained at a rate of +5.9% per year.
Volume Thrust Indicator Explained: This indicator uses NASDAQ volume data to indicate bullish and bearish conditions for the NASDAQ Composite Index. The indicator plots the ratio of the 10-day total of NASDAQ daily advancing volume (i.e., the total volume traded in stocks which rose in price each day) to the 10-day total of daily declining volume (volume traded in stocks which fell each day). This ratio indicates when advancing stocks are attracting the majority of the volume (readings above 1.0) and when declining stocks are seeing the heaviest trading (readings below 1.0). This indicator thus supports the case that a rising market supported by heavier volume in the advancing issues tends to be the most bullish condition, while a declining market with downside volume dominating confirms bearish conditions. When in a positive mode, the NASDAQ Composite has gained at a rate of +38.3% per year, When neutral, the NASDAQ has gained at a rate of +13.3% per year. And when negative, the NASDAQ has lost at a rate of -8.5% per year.
Breadth Thrust Indicator Explained: This indicator uses the number of NASDAQ-listed stocks advancing and declining to indicate bullish or bearish breadth conditions for the NASDAQ Composite. The indicator plots the ratio of the 10-day total of the number of stocks rising on the NASDAQ each day to the 10-day total of the number of stocks declining each day. Using 10-day totals smooths the random daily fluctuations and gives indications on an intermediate-term basis. As expected, the NASDAQ Composite performs much better when the 10-day A/D ratio is high (strong breadth) and worse when the indicator is in its lower mode (weak breadth). The most bullish conditions for the NASDAQ when the 10-day A/D indicator is not only high, but has recently posted an extreme high reading and thus indicated a thrust of upside momentum. Bearish conditions are confirmed when the indicator is low and has recently signaled a downside breadth thrust. In positive mode, the NASDAQ has gained at a rate of +22.1% per year since 1981. In a neutral mode, the NASDAQ has gained at a rate of +14.5% per year. And when in a negative mode, the NASDAQ has lost at a rate of -6.4% per year.
Bull/Bear Volume Relationship Explained: This indicator plots both "supply" and "demand" volume lines. When the Demand Volume line is above the Supply Volume line, the indicator is bullish. From 1981, the stock market has gained at an average annual rate of +11.7% per year when in a bullish mode. When the Demand Volume line is below the Supply Volume line, the indicator is bearish. When the indicator has been bearish, the market has lost ground at a rate of -6.1% per year.
Technical Health of 100 Industry Groups Explained: Designed to provide a reading on the technical health of the overall market, this indicator takes the technical temperature of more than 100 industry sectors each week. Looking back to early 1980, when the model is rated as "positive," the S&P has averaged returns in excess of 23% per year. When the model carries a "neutral" reading, the S&P has returned over 11% per year. But when the model is rated "negative," stocks fall by more than -13% a year on average.
Weekly State of the Market Model Reading Explained:Different market environments require different investing strategies. To help us identify the current environment, we look to our longer-term State of the Market Model. This model is designed to tell us when risk factors are high, low, or uncertain. In short, this longer-term oriented, weekly model tells us whether the odds favor the bulls, bears, or neither team.
Disclosures
The opinions and forecasts expressed herein are those of Mr. David Moenning and may not actually come to pass. Mr. Moenning's opinions and viewpoints regarding the future of the markets should not be construed as recommendations. The analysis and information in this report is for informational purposes only. No part of the material presented in this report is intended as an investment recommendation or investment advice. Neither the information nor any opinion expressed constitutes a solicitation to purchase or sell securities or any investment program.
Any investment decisions must in all cases be made by the reader or by his or her investment adviser. Do NOT ever purchase any security without doing sufficient research. There is no guarantee that the investment objectives outlined will actually come to pass. All opinions expressed herein are subject to change without notice. Neither the editor, employees, nor any of their affiliates shall have any liability for any loss sustained by anyone who has relied on the information provided.
The analysis provided is based on both technical and fundamental research and is provided "as is" without warranty of any kind, either expressed or implied. Although the information contained is derived from sources which are believed to be reliable, they cannot be guaranteed.
David D. Moenning is an investment adviser representative of Sowell Management Services, a registered investment advisor. For a complete description of investment risks, fees and services, review the firm brochure (ADV Part 2) which is available by contacting Sowell. Sowell is not registered as a broker-dealer.
Employees and affiliates of Sowell may at times have positions in the securities referred to and may make purchases or sales of these securities while publications are in circulation. Positions may change at any time.
Investments in equities carry an inherent element of risk including the potential for significant loss of principal. Past performance is not an indication of future results.
Advisory services are offered through Sowell Management Services.
Recent free content from FrontRange Trading Co.
-
 Is The Bull Argument Too Easy These Days?
— 8/31/20
Is The Bull Argument Too Easy These Days?
— 8/31/20
-
What Do The Cycles Say About 2020?
— 1/21/20
-
Modeling 2020 Expectations (Just For Fun)
— 1/13/20
-
Tips From Real-World Wendy Rhoades
— 5/06/19
-
The Best Recession Ever!
— 4/29/19
-
{[comment.author.username]} {[comment.author.username]} — Marketfy Staff — Maven — Member


- 1 Campus Martius, Suite #200Detroit, MI 48226
- +1 877 440 9464