

Should We Be Skeptical Here?
After a second consecutive week of gains in the stock market, most investors are likely breathing a sigh of relief right about now and a great many pundits can be heard proclaiming that the bear is over. To be sure, things certainly "feel better" in the stock market. And it is true that some of our indicators are starting to show some signs of improvement.
But (you knew that was coming, right?)... The bottom line is you can color me skeptical on the proclamation that it will be smooth sailing from here. While I would LOVE to be wrong, this morning I'd like to share some of the reasons why I think it may be a bit premature to start waving the green flag and singing "happy days are here again."
But before we begin, let me say for perhaps the zillionth time that I don't believe in managing money based on one's views, hunches, or feelings. No, I believe the trick to succeeding long-term in the business of investing is to (a) check your ego at the door, (b) forget about trying to "be right," and (c) have a discipline to follow. And for me, this means having a set of indicators and models designed to try and keep me on the right side of the important moves.
To clarify, this approach isn't really about "timing." We're not trying to sell tops and buy bottoms (sorry). No, the idea is to invest according to the outlook for the risk/reward environment. Or put another way, we want to be in stocks when the odds favor the bulls and reduce risk when they don't. And beginning last May, my indicators began telling me that it was time to begin reducing our exposure to market risk. As such, since that time, we've played the game cautiously. And to finish up on the overview of this approach, we will return to a "risk on" position when the indicators tell us that risk is no longer elevated.
Again, the goal is to be mostly invested when risk is low and less invested when risk is high. The idea is to get most of the really big, really important moves, mostly right.
On that topic, it is worth noting that we ARE seeing some signs of improvement in our indicators. For example, my "Desert Island Indicator" has perked up a bit recently and is actually no longer in negative territory. But, my favorite long-term indicator is not positive either and remains on a sell signal at this time. As such, I would prefer to see this indicator and others like it improve further before getting overly excited about the market from a big-picture perspective.
With my big-picture view of the world out of the way, let's return to a subjective review of why it may still be a good idea to curb one's enthusiasm about the market here...
Reasons To Be Skeptical (At This Stage)
First and foremost, a spirited rebound (aka a "dead cat bounce") is almost always to be expected when stocks become oversold and sentiment reaches extremely negative levels. And this is especially true when a successful "retest" of the lows is accompanied by the view that the reasons for the decline are waning. As such, it is important to recognize that the type of bounce we've seen recently is completely normal.
At this stage of the game, the challenge is to try and figure out when a bounce is more than just an oversold bounce. And there is very little question that this can be tricky. However, let's go ahead and give it a try here.
While it is nearly impossible to know the answer to this question without a very strong dose of hindsight, one can obtain a hint or two by looking at the key causes of the decline and asking: Has anything changed?
Has Anything Changed?
If one looks at the trends of the U.S. stock market, they can argue that things have changed and are on the cusp of changing further - in a good way.
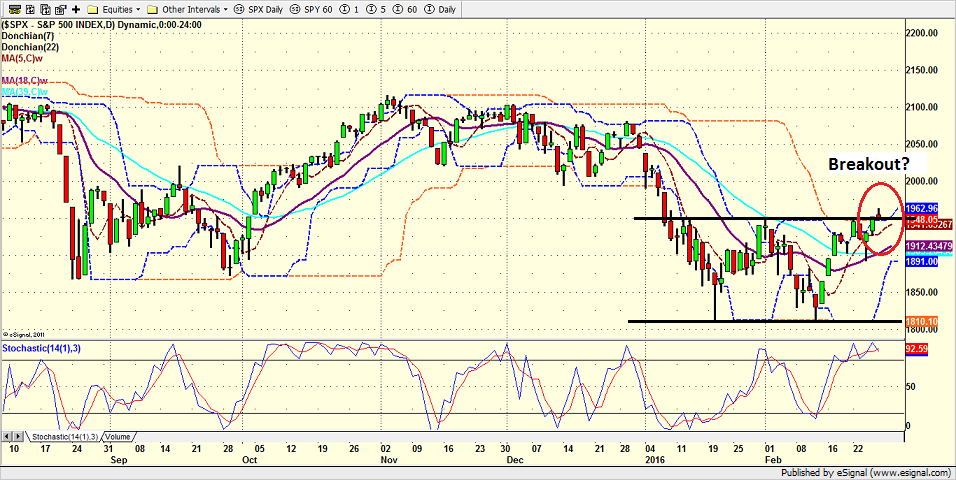
S&P 500 - Daily 
View Larger Image
The good news is that, just as we saw last fall, the S&P 500 appears to have put in a very nice "double bottom" on the daily chart. Thus, the bulls will argue that the downtrend is either over or has at the very least been put on pause while the countertrend rally unfolds.
The key question is whether or not the bulls have wrestled control away from the bears. I'm of the mind that from the short-term perspective, the 1950 level on the S&P is the key line in the sand. If stocks can first break above this level with some "oomph" and then hold on, there is likely more upside ahead. But if the bears can hold this line, another test of the lows is the likely next order of business.
To get a feel for which team has the edge in the battle for 1950, let's take a look at some charts. First up is the S&P on a weekly basis.
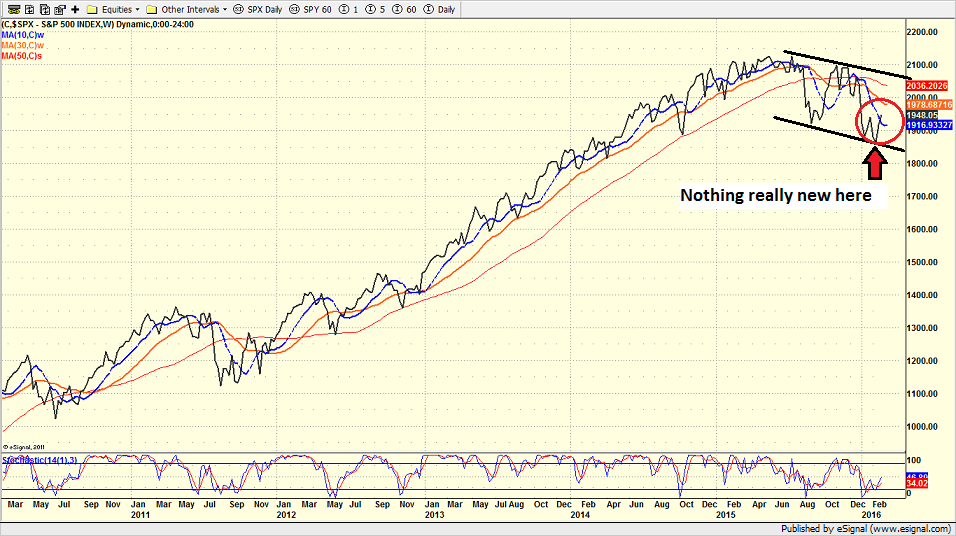
S&P 500 - Weekly 
View Larger Image
While the indicators have improved a bit (more on this later in the week), there is really nothing new to report on the weekly chart of the S&P. The bounce looks like a bounce, the index remains in a downtrend, and the recent move up hasn't changed the longer-term picture in any way.
Now let's turn our attention to the key features of the decline including oil, the state of the economy, and the banks.
First up is oil. As I've written recently, oil doesn't have to rally big in order for stocks to recover. No, crude simply needs to stop its rude move lower. Thus, we'd like to see a bottom begin to unfold on the charts. Remember, with a move like we've seen in oil, bottoms are a process - not an event.
US Oil Fund (USO) - Weekly 
View Larger Image
Although crude futures have enjoyed a decent run higher of late and there is talk of output cuts coming, the bottom line is that the action on the chart of the USO suggests that the bottoming process is just beginning. If things go according to plan, we should see a bounce higher in oil and then a testing phase.
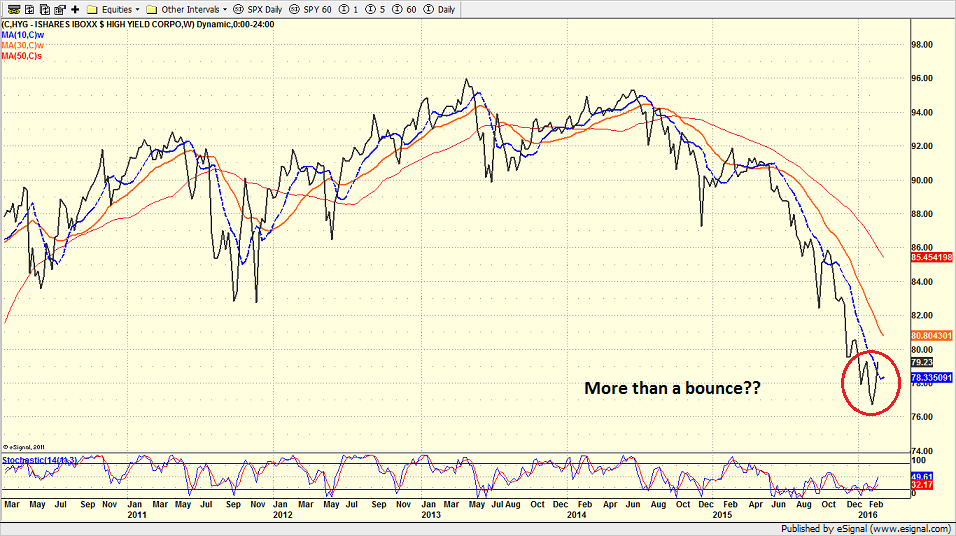
Next up is the junk bond market. Recall that one of the major keys to the bear market in stocks has been the idea of contagion from the crash in oil. And the junk bond market has become a key proxy for the idea of the trouble in the oil patch spilling over into other sectors of the economy. Thus, in order for stock market players to feel comfy about the future, junk must improve as well.
iShares IBOXX High Yield (HYG) - Weekly 
View Larger Image
The good news is the chart of the HYG shows that a spirited bounce is underway. The question, of course, is if the move is sustainable. And yep, you guessed it; at this stage, the move up appears to be a bounce of the dead cat variety. Thus, we may need to see a retest of the lows in order to have confidence that the monster decline has ended.
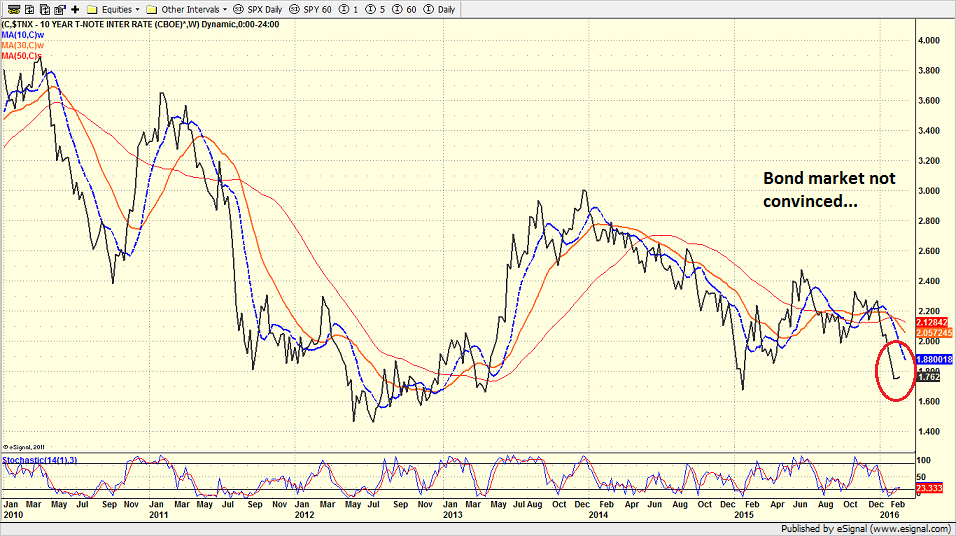
Taking a step further down the road of the "state of the economy," let's now take a look at the action in the U.S. government bond market. The bottom line here is that if the fears about the economy that drove stock prices lower are indeed waning, then we should see yields start to climb.
US 10-Year Treasury Yield - Weekly 
View Larger Image
While I am a card-carrying member of the glass-is-half-full club when it comes to the markets, I must admit that the bond market isn't exactly displaying much enthusiasm at this stage.
Now let's turn to the banks.
KBW Bank Index - Weekly 
View Larger Image
On the chart of the U.S. banks, the good news/bad news situation is also apparent. Yes, there is a bounce underway. But at the same time, there is no base in place on the chart at this time. So again, the question is whether or not the move is sustainable.
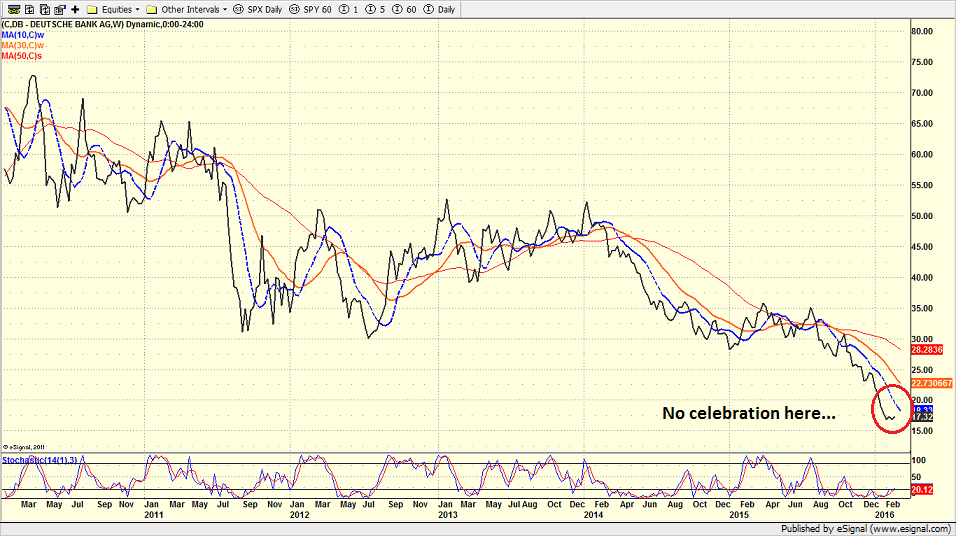
In my humble opinion, the key to this issue is the state of the European banks. So once again, let's take a look at our proxies for the banks on the other side of the Atlantic - Deutsche Bank (NYSE: DB) and Credit Suisse (NYSE: CS).
Deutsche Bank (DB) - Weekly 
View Larger Image
While the degree of the move down in DB has been significant and therefore even a substantial bounce may not look like much on a weekly chart, it is safe to say that there is virtually no optimism being displayed on this chart.
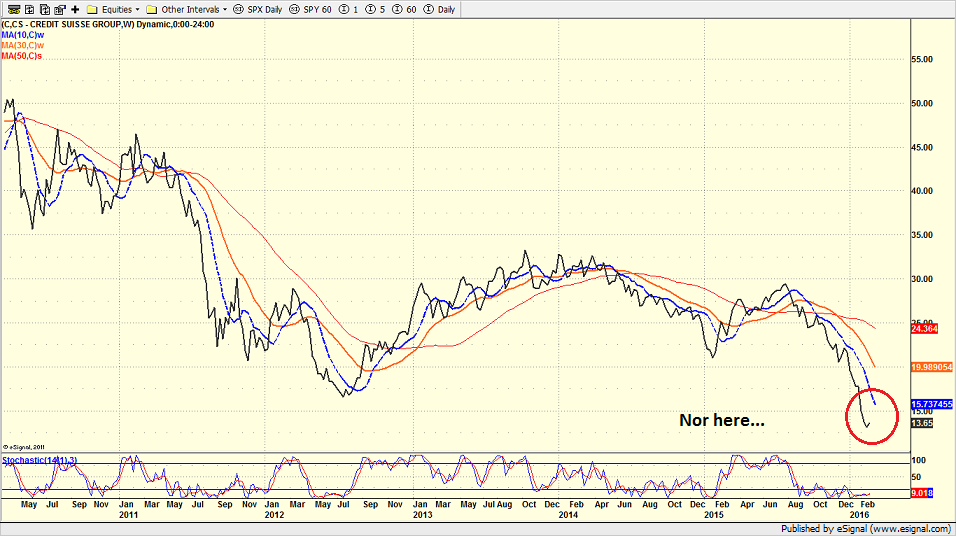
Credit Suisse (CS) - Weekly 
View Larger Image
And unfortunately, it's the same situation on the chart of Credit Suisse. As such, it is very hard to argue that the worries about the European banks have subsided.
The Takeaway...
I am actually fairly optimistic about the potential for the current stock market rally to continue - especially given the recent action. In addition, we do need to remember that Super Mario is likely to announce more QE in the near future and that the Chinese could start taking stimulative steps at any time. And finally, I can argue that we've seen the lows of this bear market.
Yet, I believe it is important to remember that the "issues" that drove the market down may not be resolved at this point. And in my opinion, THIS is the key to how far the current rally can run. Therefore, the action in the coming days is likely to be critical - especially with another jobs report on tap at the end of the week.
Turning to This Morning
In a surprise move, the People's Bank of China cut its reserve requirement ratio (RRR) for all banks overnight. The move was the fifth in the last 13 months and took the rate down 17% for the biggest banks. The PBOC said the move was intended to maintain ample liquidity and create the appropriate environment to support supply side reforms. The cut was a surprise however, given repeated signals from Beijing that it would instead pursue targeted liquidity injections to avoid exacerbating yuan weakness and promoting overly easy monetary policy conditions. As expected the yuan weakened on the news and stocks fell. Next up, the G20 underwhelmed in their statement as the meeting produced no specific coordinated stimulus efforts. In response, European markets started lower and have since recovered and U.S. futures have followed suit.
Today's Pre-Game Indicators
Here are the Pre-Market indicators we review each morning before the opening bell...
Major Foreign Markets:
Japan: -1.00%
Hong Kong: -1.30%
Shanghai: -2.87%
London: +0.05%
Germany: -0.49%
France: +0.33%
Italy: +0.64%
Spain: +0.76%
Crude Oil Futures: +$0.43 to $33.21
Gold: +$9.00 at $1229.40
Dollar: higher against the yen and euro, lower vs. pound
10-Year Bond Yield: Currently trading at 1.7546%
Stock Indices in U.S. (relative to fair value):
S&P 500: +0.40
Dow Jones Industrial Average: +6
NASDAQ Composite: -1.10
Thought For The Day:
Expectations are the root of all heartache -- Shakespeare
Here's wishing you green screens and all the best for a great day,

David D. Moenning
Founder and Chief Investment Strategist
Heritage Capital Research
Looking for a "Modern" approach to Asset Allocation and Portfolio Design?
Would you like help developing a custom designed portfolio?
Looking for More on the State of the Markets?
Looking to modernize your asset allocations, add risk management to client portfolios, or outsource portfolio design? Contact Eric@SowellManagement.com
Current Market Drivers
We strive to identify the driving forces behind the market action on a daily basis. The thinking is that if we can both identify and understand why stocks are doing what they are doing on a short-term basis; we are not likely to be surprised/blind-sided by a big move. Listed below are what we believe to be the driving forces of the current market (Listed in order of importance).
1. The State of the Oil Crisis
2. The State of Global Central Bank Policy
3. The State of the Stock Market Valuations
4. The State of Global Growth
The State of the Trend
We believe it is important to analyze the market using multiple time-frames. We define short-term as 3 days to 3 weeks, intermediate-term as 3 weeks to 6 months, and long-term as 6 months or more. Below are our current ratings of the three primary trends:
Short-Term Trend (1 - 3 Weeks): Positive
(Chart below is S&P 500 daily over past 1 month)
Intermediate-Term Trend (1 - 6 Months): Moderately Negative
(Chart below is S&P 500 daily over past 6 months)
Long-Term Trend (6 - 18 Months): Moderately Negative
(Chart below is S&P 500 daily over past 2 years)
Key Technical Areas:
Traders as well as computerized algorithms are generally keenly aware of the important technical levels on the charts from a short-term basis. Below are the levels we deem important to watch today:
- Key Near-Term Support Zone(s) for S&P 500: 1945
- Key Near-Term Resistance Zone(s): 2000
The State of the Tape
Momentum indicators are designed to tell us about the technical health of a trend - I.E. if there is any "oomph" behind the move. Below are a handful of our favorite indicators relating to the market's "mo"...
- Trend and Breadth Confirmation Indicator (Short-Term): Positive
- Price Thrust Indicator: Positive
- Volume Thrust Indicator(NASDAQ): Positive
- Breadth Thrust Indicator (NASDAQ): Positive
- Short-Term Volume Relationship: Moderately Positive
- Technical Health of 100+ Industry Groups: Neutal
The Early Warning Indicators
Markets travel in cycles. Thus we must constantly be on the lookout for changes in the direction of the trend. Looking at market sentiment and the overbought/sold conditions can provide "early warning signs" that a trend change may be near.
- S&P 500 Overbought/Oversold Conditions:
- Short-Term: Neutral
- Intermediate-Term: Moderately Oversold
- Market Sentiment: Our primary sentiment model is Neutral
The State of the Market Environment
One of the keys to long-term success in the stock market is stay in tune with the market's "big picture" environment in terms of risk versus reward.
- Weekly Market Environment Model Reading: Neutral
Indicator Explanations
Trend and Breadth Confirmation Indicator (Short-Term) Explained: History shows the most reliable market moves tend to occur when the breadth indices are in gear with the major market averages. When the breadth measures diverge, investors should take note that a trend reversal may be at hand. This indicator incorporates an All-Cap Dollar Weighted Equity Series and A/D Line. From 1998, when the A/D line is above its 5-day smoothing and the All-Cap Equal Weighted Equity Series is above its 25-day smoothing, the equity index has gained at a rate of +32.5% per year. When one of the indicators is above its smoothing, the equity index has gained at a rate of +13.3% per year. And when both are below, the equity index has lost +23.6% per year.
Price Thrust Indicator Explained: This indicator measures the 3-day rate of change of the Value Line Composite relative to the standard deviation of the 30-day average. When the Value Line's 3-day rate of change have moved above 0.5 standard deviation of the 30-day average ROC, a "thrust" occurs and since 2000, the Value Line Composite has gained ground at a rate of +20.6% per year. When the indicator is below 0.5 standard deviation of the 30-day, the Value Line has lost ground at a rate of -10.0% per year. And when neutral, the Value Line has gained at a rate of +5.9% per year.
Volume Thrust Indicator Explained: This indicator uses NASDAQ volume data to indicate bullish and bearish conditions for the NASDAQ Composite Index. The indicator plots the ratio of the 10-day total of NASDAQ daily advancing volume (i.e., the total volume traded in stocks which rose in price each day) to the 10-day total of daily declining volume (volume traded in stocks which fell each day). This ratio indicates when advancing stocks are attracting the majority of the volume (readings above 1.0) and when declining stocks are seeing the heaviest trading (readings below 1.0). This indicator thus supports the case that a rising market supported by heavier volume in the advancing issues tends to be the most bullish condition, while a declining market with downside volume dominating confirms bearish conditions. When in a positive mode, the NASDAQ Composite has gained at a rate of +38.3% per year, When neutral, the NASDAQ has gained at a rate of +13.3% per year. And when negative, the NASDAQ has lost at a rate of -8.5% per year.
Breadth Thrust Indicator Explained: This indicator uses the number of NASDAQ-listed stocks advancing and declining to indicate bullish or bearish breadth conditions for the NASDAQ Composite. The indicator plots the ratio of the 10-day total of the number of stocks rising on the NASDAQ each day to the 10-day total of the number of stocks declining each day. Using 10-day totals smooths the random daily fluctuations and gives indications on an intermediate-term basis. As expected, the NASDAQ Composite performs much better when the 10-day A/D ratio is high (strong breadth) and worse when the indicator is in its lower mode (weak breadth). The most bullish conditions for the NASDAQ when the 10-day A/D indicator is not only high, but has recently posted an extreme high reading and thus indicated a thrust of upside momentum. Bearish conditions are confirmed when the indicator is low and has recently signaled a downside breadth thrust. In positive mode, the NASDAQ has gained at a rate of +22.1% per year since 1981. In a neutral mode, the NASDAQ has gained at a rate of +14.5% per year. And when in a negative mode, the NASDAQ has lost at a rate of -6.4% per year.
Bull/Bear Volume Relationship Explained: This indicator plots both "supply" and "demand" volume lines. When the Demand Volume line is above the Supply Volume line, the indicator is bullish. From 1981, the stock market has gained at an average annual rate of +11.7% per year when in a bullish mode. When the Demand Volume line is below the Supply Volume line, the indicator is bearish. When the indicator has been bearish, the market has lost ground at a rate of -6.1% per year.
Technical Health of 100 Industry Groups Explained: Designed to provide a reading on the technical health of the overall market, this indicator takes the technical temperature of more than 100 industry sectors each week. Looking back to early 1980, when the model is rated as "positive," the S&P has averaged returns in excess of 23% per year. When the model carries a "neutral" reading, the S&P has returned over 11% per year. But when the model is rated "negative," stocks fall by more than -13% a year on average.
Weekly State of the Market Model Reading Explained:Different market environments require different investing strategies. To help us identify the current environment, we look to our longer-term State of the Market Model. This model is designed to tell us when risk factors are high, low, or uncertain. In short, this longer-term oriented, weekly model tells us whether the odds favor the bulls, bears, or neither team.
Disclosures
The opinions and forecasts expressed herein are those of Mr. David Moenning and may not actually come to pass. Mr. Moenning's opinions and viewpoints regarding the future of the markets should not be construed as recommendations. The analysis and information in this report is for informational purposes only. No part of the material presented in this report is intended as an investment recommendation or investment advice. Neither the information nor any opinion expressed constitutes a solicitation to purchase or sell securities or any investment program.
Any investment decisions must in all cases be made by the reader or by his or her investment adviser. Do NOT ever purchase any security without doing sufficient research. There is no guarantee that the investment objectives outlined will actually come to pass. All opinions expressed herein are subject to change without notice. Neither the editor, employees, nor any of their affiliates shall have any liability for any loss sustained by anyone who has relied on the information provided.
The analysis provided is based on both technical and fundamental research and is provided "as is" without warranty of any kind, either expressed or implied. Although the information contained is derived from sources which are believed to be reliable, they cannot be guaranteed.
David D. Moenning is an investment adviser representative of Sowell Management Services, a registered investment advisor. For a complete description of investment risks, fees and services, review the firm brochure (ADV Part 2) which is available by contacting Sowell. Sowell is not registered as a broker-dealer.
Employees and affiliates of Sowell may at times have positions in the securities referred to and may make purchases or sales of these securities while publications are in circulation. Positions may change at any time.
Investments in equities carry an inherent element of risk including the potential for significant loss of principal. Past performance is not an indication of future results.
Advisory services are offered through Sowell Management Services.
Recent free content from FrontRange Trading Co.
-
 Is The Bull Argument Too Easy These Days?
— 8/31/20
Is The Bull Argument Too Easy These Days?
— 8/31/20
-
What Do The Cycles Say About 2020?
— 1/21/20
-
Modeling 2020 Expectations (Just For Fun)
— 1/13/20
-
Tips From Real-World Wendy Rhoades
— 5/06/19
-
The Best Recession Ever!
— 4/29/19
-
{[comment.author.username]} {[comment.author.username]} — Marketfy Staff — Maven — Member


- 1 Campus Martius, Suite #200Detroit, MI 48226
- +1 877 440 9464