

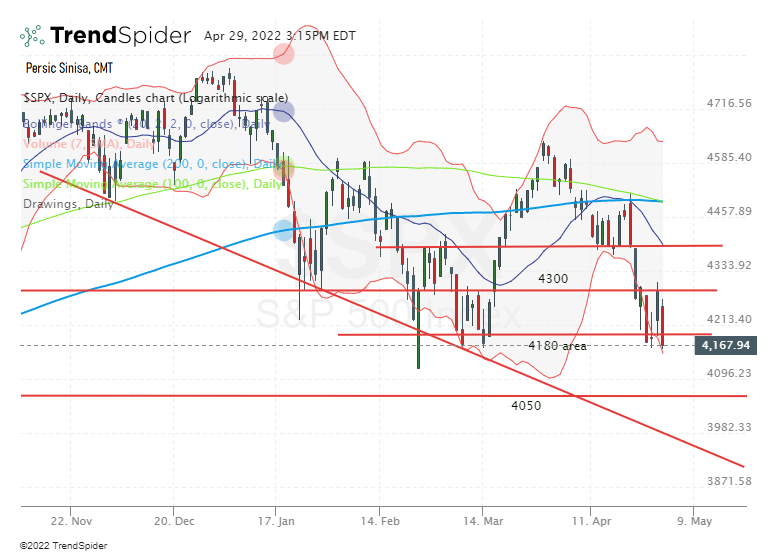
S&P 500 INDEX (^SPX) daily chart analysis
S&P 500 INDEX (^SPX) daily chart analysis suggests a high possibility for a further decline during the next week and set up of a new low in the 3980-4050 area. Key support levels are annotated on the S&P 500 INDEX (^SPX) chart below.
Recent free content from Sinisa Persic
-
 S&P 500 INDEX (^SPX) short term outlook
— 11/02/22
S&P 500 INDEX (^SPX) short term outlook
— 11/02/22
-
Trade Idea for Tue, Apr 12, 2022
— 4/12/22
-
Watch List for the coming week...
— 3/20/22
-
3 stocks with high relative strength vs. S&P 500
— 1/20/22
-
S&P 500 INDEX (^SPX) intraday chart analysis
— 12/21/21
No comments. Break the ice and be the first!
Error loading comments
Click here to retry
No comments found matching this filter
-
{[comment.author.username]} {[comment.author.username]} — Marketfy Staff — Maven — Member
Want to add a comment? Take me to the new comment box!

- 1 Campus Martius, Suite #200Detroit, MI 48226
- +1 877 440 9464