Just a reminder, we usually try to include points from both sides of the bull/bear ledger each weekend. However, in our “summary,” we always make sure to let you know which side of that ledger we stand at any given time. Thank you.
THE WEEKLY TOP 10
Table of Contents:
1) The stock market is at a key juncture, so next week’s action should be extremely important.
2) 2+2 does not = 5.
3) Last week’s strong bounce COULD be the start of a multi-week rally.
4) The stock market (and most stocks) have not become cheap at all.
5) Neither the broad market nor the tech stocks (nor much else) had become extremely oversold early last week.
6) Deep declines rarely just fizzle out. They usually need a catalyst for form a bottom.
7) The intermediate-term chart on Salesforce.com (CRM) looks VERY intriguing.
8) The biotech group is testing a key resistance level.
9) We continue to make great calls in these very volatile markets. (Think China’s FXI.)
10) Summary of our current stance.
1) Last week’s rally in the stock market was obviously a very strong one. It helped the S&P 500 Index and the NDX Nasdaq 100 Index break above some key resistance levels…and left them testing some other ones. Therefore, next week is going to be a VERY important one for the technical condition of the stock market as we move towards the end of the first quarter.
The 7.2% rally off the Monday afternoon low…to the Friday closing level on the S&P 500 Index…helped give this all-important index the best one-week rally in over 18 months. The more than 10% bounce in the NDX Nasdaq off the Monday lows was even more impressive. As we move through this weekend’s piece, we’ll discuss the reasons for the rally…and whether we think those reasons will help the stock market rally further over the coming days and weeks. However, we’d like to begin this weekend’s edition by looking at the technical condition of the stock market.
Last week was obviously a very good one on a technical basis, but it still left the S&P 500 and the NDX 100 testing important resistance levels….and they’re going to need some nice upside follow-through at some point next week to signal that last week’s bounce was more than just a very short-term phenomenon. Therefore, the action in these indices next week should be quite important.
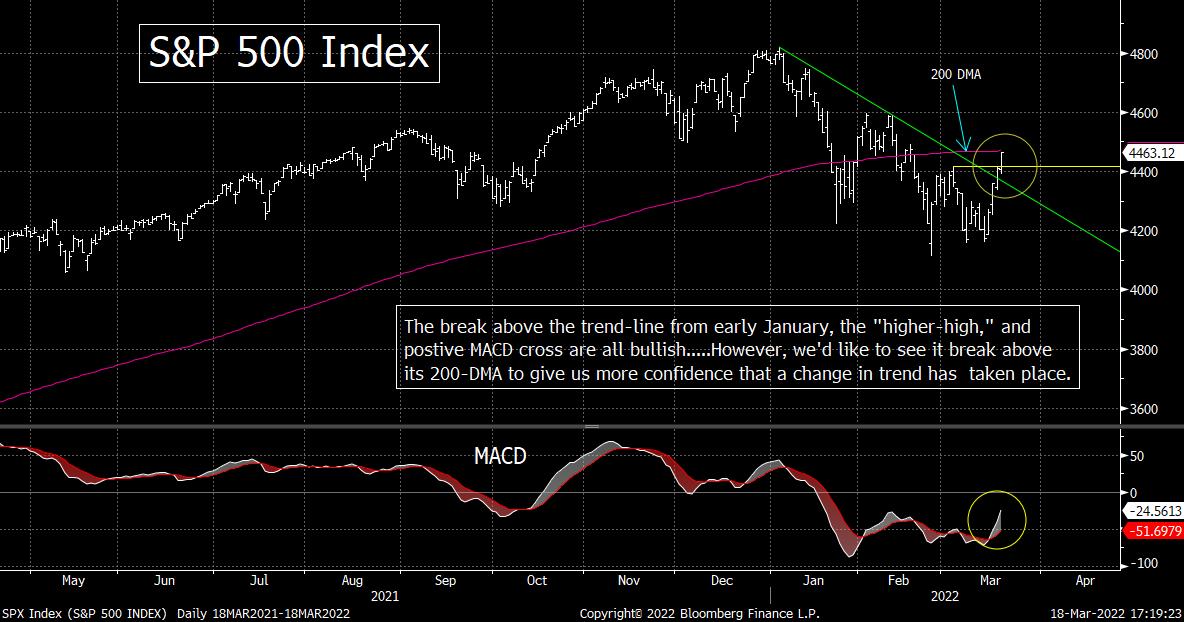
Let’s start with the S&P 500. It broke above its trend-line from the early January highs…and it saw a compelling “positive cross” on its MACD chart. It also gave us a “higher-high” above its early March highs. However, that “higher-high” is only a slight one so far…and the index closed RIGHT ON its 200-DMA. Therefore, it’s going to need to see more upside follow-through next week to signal that the stock market has regained the upside momentum it had last year.
If the S&P can break meaningfully above that 200 DMA of 4470 (and thus give it a more compelling “higher-high”), it’s going to be quite bullish. If, however, it rolls-over in a significant way (which is quite possible), it will show that last week’s rally was merely a bear market rally (or a “sucker’s rally” as some people like to call them). Needless to say, that would be extremely bearish.
Having said this, we DO need to point out that the upside follow-through does not have to come immediately. After such a strong rally last week, it could see a bit of a “breather” on the first day or two of trading next week. So as long as the market does not roll-over in a serious fashion early next week, we’ll want to hold-off drawing any conclusions. However, it WILL need to avoid a dramatic reversal lower…and it will probably need to break above last week’s highs…to give the bulls any real confidence that this bounce will have some legs. (Another way to describe what we’ll be looking for next week is say that the longer it takes to regain its upside momentum next week, the lower the odds will become that the rally will have more legs in the coming weeks.)
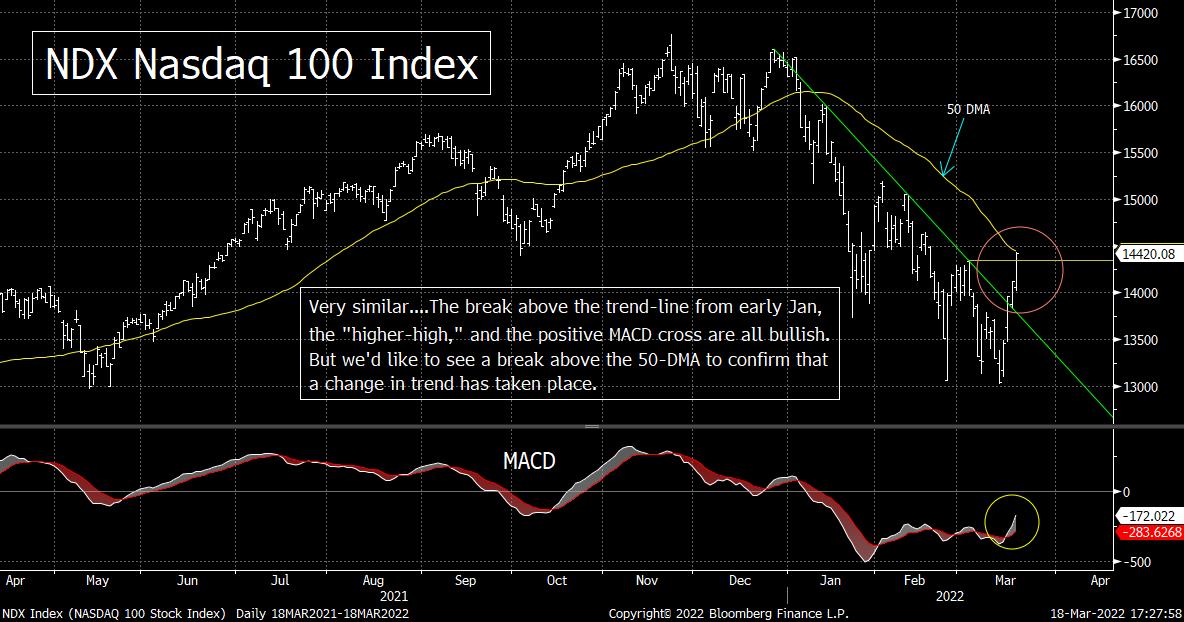
As for the NDX, it is a very similar situation. The tech-laden index also broke above its trend-line from the beginning of the year…and also saw a positive MACD cross. It saw a similar “higher-high” (but its higher-high was even a more “slight” one than the S&P’s). The one difference is that instead of closing RIGHT ON it’s 200-DMA, the NDX closed RIGHT ON its 50-DMA. Therefore, we’ll be looking to see if it can break meaningfully above that line at some point next week. (Like it is with the SPX, it does not have to happen immediately, but it DOES need to avoid a serious reversal lower…and it does need to see some upside follow-through at some point during the week). If it CAN take out its 50-DMA in a material way (which would also give it a more compelling “higher-high”), it will indeed be very bullish on a technical basis. If it fails, however, and rolls-over, it will indicate that last week’s big rally was nothing more than a bear market rally.
Either way, next week should be a very important one for the stock market. As we will discuss later in this weekend’s piece, not a whole lot changed last week on the fundamental side of things. Don’t get us wrong, there WAS some positive news…like more negotiations between Ukraine and Russia…and a further decline in crude oil and other commodities on the week. However, the fighting on the ground in Ukraine remained intense, oil prices did rebound late in the week, the Treasury market became much less friendly, and (most importantly) the Fed became even a bit more hawkish than they had been going into this month.
Therefore, this rally was not fundamentally based in any serious manner. It had more to do with short covering and “positive gamma” than it did with anything on the fundamental side of things. We’d also note that despite what several pundits said last week, the stock market had not become “massively oversold”…nor had it become “extremely cheap” early last week either. (Again, more on these items in later bullet points.) This is why we are saying that it is quite possible that the market could roll-over in a serious manner at some point next week. (Now that we’ve gotten past expiration, the impact of short covering and positive gamma could fade rather quickly.)……….In other words, hold on to your hats, next week could/should be another wild one.
2) We spent a lot of time talking about the issue of leverage last weekend…and how the unwinding of that leverage that almost HAS to take place with the Fed engaging more deeply in their tightening program…will likely take the stock market even lower as we move through the year. However, the issue of leverage is much more than a story of added supply and or added demand in the stock market. It IS a fundamental story as well! Therefore, the further decline we’re looking for in stocks before 2022 is over…WILL be fundamentally based.
Last weekend, we spent a lot of time talking about the issue of leverage. We highlighted that there is STILL a massive level of leverage in the system today.…and as that continues to get unwound, it will take the stock market even lower than the lows it has seen so far this year. This might sound like a technical (supply/demand) issue, but it is actually based on the fundamentals. When the Fed was pushing all of that massive stimulus/liquidity into the financial system in March of 2020 (in order to save the system), it wasn’t long before investors began adding huge levels of leverage to their portfolios. Yes, that DID change the supply/demand equation for stocks even further in the direction of “demand.” That, in turn, pushed the stock market far beyond anything that would be justified by the underlying fundamentals…especially when they kept the emergency level of stimulus pumping…long after the emergency had passed. (All you had to do was look at the 22 multiple that existed on the S&P 500 at the end of the year to see this phenomenon.)
NOW, as the Fed reverses the flow of stimulus as we move through the year this year, it is going to flip the supply/demand equation 180 degrees. Now that the Fed has signaled that they are going to raise rates and shrink their balance sheet…and has also signaled in a definitive way that the “Fed put” is now much further out-of-the-money than it used to be…investors will not longer had the confidence to carry as much leverage as they did over the 21 months leading into the end of 2021. Also, as the market goes down, they will be forced to lower the amount of leverage they are carrying. Therefore, the supply/demand equation will shift (and has been shifting) decidedly to the side of “supply.”
Going back to the fundamental side of the story, the fact that the stock market had been pushed to such extreme valuation levels, it meant that the stock market would go down EVEN if the economy did not slowdown. If the economy continued to grow, the stock market would merely have fallen to a level where “price” and “earnings” met somewhere in the middle.
The problem is that the odds are very high that the level of economic growth and earnings growth we’re going to see this year are very likely going to be much slower than the experts were thinking at the beginning of the year. As we highlighted last weekend, several firms on Wall Street have already lowered their growth expectations for 2022 down below 2% (from above 4% just a few months ago…October). The consensus earnings estimates have not come at all yet. We HAVE seen Goldman lower their full year estimates slightly (down to about $220 on the S&P 500), but the consensus is still above $225.
With the further rise in inflation…and the ensuing pressures on margins that are likely to occur…it’s going to be very difficult to avoid a significant drop in earnings estimates as we go through the upcoming earnings season (next month). Also, the fact that the “supply chain” problem is being extended (in a material way) by the war in eastern Europe, the inflation problem will be more pronounced for a longer period of time than most people were looking for in January. (We didn’t even mention the impact wage inflation is going to have going forward.)
What is going to happen if the rise in earnings this year is only going to be in the low single digits (God forbid)? If earnings growth expectations drop to something like 3% for the year by May or June…which would take us to about $215…that would put the P/E ratio back up at 20.7x earnings if the S&P 500 stays at/near its current level. Let’s face it, we came into this year with the consensus looking a rise of just 8% in S&P earnings this year (from $208.50 in 2021 to $226ish forecast for 2022)…so it won’t take much of a re-calculation to move that number down into the low single digits. Needless to say, if those estimates fall even further…or if last week’s bounce lasts through April…the forward P/E will obviously move even higher than 20.7x in the weeks ahead.
All of those above projections are assuming that inflation comes back down to a level near the Fed’s long-term goals of 2%. Right now, the Fed is projecting 2.7% inflation for 2023 and 2.3% in 2024. However, the Treasury market (the TIPS) is telling us that inflation over the next five years will be running above 3.5% (the highest in over 20 years)! Therefore, even though inflation will likely fall from its torrid levels of the past several quarters, it looks like it’s going to remain quite high for an extended period of time. THAT will not be good for profit margins…which will not be good for earnings. Therefore, the “E” part of the “P/E” ratio could fall even more than we just talked about in the previous paragraph.
Of course, inflation might indeed be brought under control. However, to do that, the Fed will have to be VERY aggressive in raising rates…and higher interest rates will cause the P/E ratio that would be considered “fairly valued” on the S&P 500 to fall from its 10-year average (in the high-teens)…to its longer-term average (in the mid-teens). That would take the S&P 500 down into the 3600-3700 range (assuming earnings estimates do not come down at all…which is VERY unlikely).
So as you can see, the numbers that the bulls are using to say that the market can move a lot higher from here just don’t add up. It will be VERY difficult to lower the rate of inflation in this environment without raises rates significantly…and it will be even harder to get the kind of earnings the consensus is looking for if interest rates rise significantly (and thus demand is lowered). In other words, the bulls are trying to tell us that 2+2 = 5.
This takes us back to the issue of leverage. Once investors realize that the fundamentals cannot keep the stock market at its current levels throughout the rest of this year, they will have to unwind their leverage even further. History tells us that when the addition of extremely large levels of leverage takes the stock market to very expensive levels, the unwinding of that leverage pretty much always takes the market to a very cheap valuation level. In other words, the issue of leverage takes the pendulum from one extreme to the other. It does not stop in the middle (at “fairly valued”). If that is the case once again this time around, the lows we see this year in the S&P could be well below 4,000.
3) Even though we just laid out a rather gloomy forecast for the stock market for the rest of this year, it does not mean that last week’s rally cannot last for several more weeks. Let’s face it, you do not ALWAYS need a big washout or “capitulation” move to form a bottom. Also, just because a lot of last week’s rally was due to “short covering,” it does not mean that the rally will fail. (ALL rallies that come after sharp declines begin with short covering.)
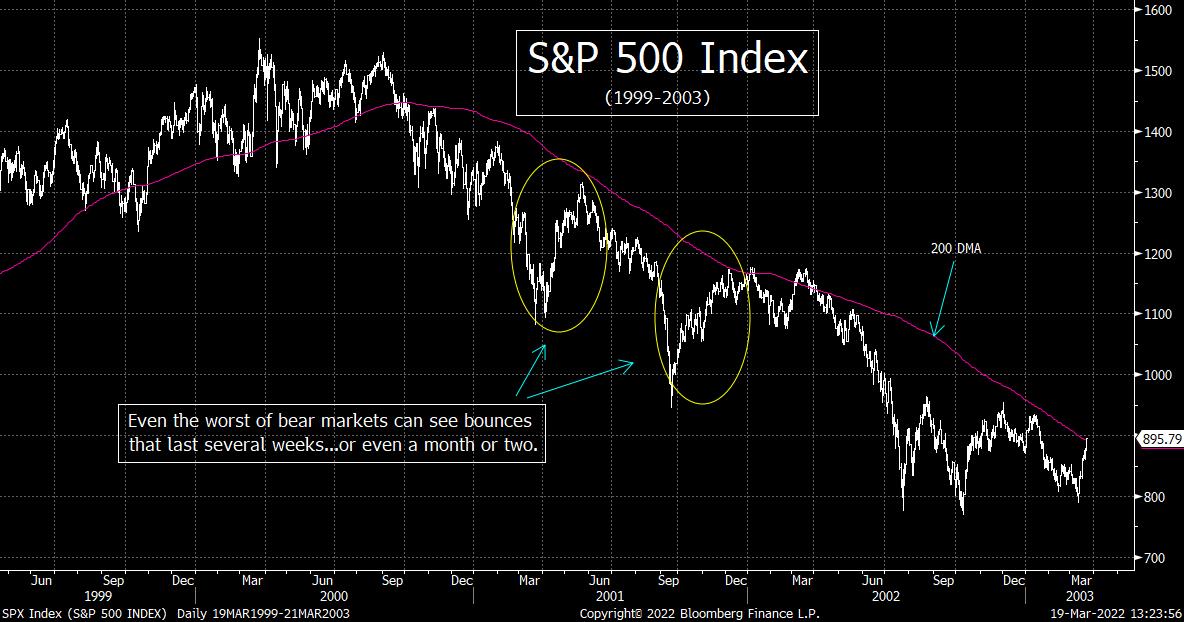
As we all know, even the worst bear markets in history have sharp rallies in the middle of them. The same is true for deep corrections. Frequently, these bear market (sucker’s) rallies can last many weeks…and sometimes even a couple of months. Therefore, last week’s bounce could be with us for a while…EVEN if a decline to a lower-low is going to take place (like we think it will). We certainly saw multi-week/month rallies in 2001 and 2008. We’d also note that experience tells us that when you get the kind strong rally we got last week, it tends to carry forward for a least a little while. The problem we face today is that we could get some negative “new-news” out of eastern Europe that would reverse this bounce very, very quickly. (Besides, not all sharp bounces see more upside follow-through.) However, the action we saw last week WAS the kind that tends to hold for a while…so the bears will want to remain nibble on a short-term basis.
We also want put some of the bearish arguments in perspective. For instance, there is one particular item that a lot of technicians are pointing to as something that tells us we need to (at least) retest the 2022 lows…and likely break below them…before we make a lasting bottom. They highlight the fact that we have not seen a big “capitulation” move on the downside. We haven’t seen that day when volume is off the charts (7-8bn on the composite volume)…and breadth that is 25 or 30-to-1 negative on the S&P 500 (and worse on the Nasdaq).
We agree that this is something that we have not seen yet…and it is certainly something we USUALLY see when a significant decline sees a bottom of some importance. HOWEVER, it is not something we HAVE to see before a bottom is make. Just look at the important bottoms in September of 2015 and February 2016. Both came after a 12%-14% decline…and were followed by strong double-digit advances over the following months. Neither of them saw a big “capitulation/washout” when the bottomed out. The same is true for the decline in 2011 (during the European crisis). We DID see a big rise in volume in August of that year, but the bottom did not come until late October of that year…and the volume was quite normal when THE low for that 19% decline was formed in 2011.
We’d also note that the fact that much of last week’s rally was due to “short covering” and “positive gamma” (which is a form of short covering) is not something that necessarily deserves to be on the negative side of the bull/bear ledger. Yes, when the stock market is in the middle of a bear market (or a deep correction), the stock market DOES sometimes fail and roll-over VERY quickly. However, as we just pointed out, sometimes it can last for a while. Therefore, we ALWAYS have to be concerned about this potential. (In fact, we believe that this rally IS a bear market rally…but we also know that we have to be cognizant that it could be one that has legs.)
However, the important thing to know is that EVERY initial bounce that takes place after a sharp decline (especially one that lasts for a couple of months) ALWAYS begin with “short covering.” That’s right, when the stock market sees a double-digit decline over several months, it takes a lot of confidence away from investors. Therefore, it takes time for them to regain enough confidence to put a lot of “new money” back into the stock market. Thus, even the bottoms that are important/long-lasting ones…begin with short covering (as a lot of shorts tend to build up during a multi-month decline). In other words, nobody should expect to see a lot of “real buying” at the very beginning of ANY advance that comes after a large decline. Therefore, the fact that a lot of last week’s rally was spurred on by short covering is not something people should be concerned about in-and-by-itself.
Having said all this, what we’re really saying is that it is VERY DIFFICULT to figure out if a short covering rally after a sharp decline is the real deal or not. Therefore, even though we’re saying that the “short covering” that has taken place recently does not mean the rally won’t fail…it also doesn’t mean that it will last either. However, we just wanted to set the record straight on this technical issue.
What we’re trying to say here is that despite our very cautious stance on the stock market for the balance of this year…and our belief that the market will likely take out its March lows at some point in the future (or at least test those lows…which happens VERY frequently in large declines). It might not come immediately. Mr. Market might suck the bulls back in for a longer period of time before he spits them back out. However, based on what we have said in our previous bullet points…and will say in several of the other bullet points below…we think investors should take any further upside movement as an opportunity to raise cash and add to defensive positions.
4) We keep hearing how a lot of the froth that had crept into the marketplace in 2021 has already been wrung-out of the markets with this year’s decline. We also hear a lot of pundits say that many/most of the problems we’re facing right now (or are likely to face going forward) have already been “priced into” the markets. The problem is that although the valuations of many stocks have come down significantly, they’re still high on an historical basis (think pre-March 2020…when the Fed got involved in their massive stimulus plane).
There is no question that SOME stocks have become quite cheap after the massive decline in their individual prices. Heck, BABA fell to 10.3x forward earnings late last week. There are still some questions if the stock can see a sustainable rally given how many times China has claimed they were going to ease-off in terms of there crackdown on tech companies…only to reassert the clamp down shortly thereafter. However, there is still no question that it’s valuation level had become very attractive. In other words, it was merely some outside factors that was keeping investors from buying the stock…not its valuation level. (Then again, the ADRs of BABA are not real ownership, but that’s a discussion for another time.)
However, there are lot of other stocks that have become mush less expensive…but have yet to reach a level that can be considered cheap on any historical basis. In fact, many of these stocks (like AAPL, MSFT, NVDA) that are still at valuation levels that have only been exceeded in the last decade during the period between March 2020 and the end of last year. In other words, it took an historic and MASSIVE stimulus program to push these stocks to their extreme levels of valuation…and their recent declines have only made them “less expensive”…not “cheap.” They are still at levels that have only been achieved when the Fed was engaged in an historic stimulus program…and now the Fed is engaged in the exact opposite of what they had been doing for almost two years.
Of course, you can always find stocks that are cheap. Therefore, we’re NOT trying to say that there aren’t ANY opportunities in the marketplace right now. We’re merely pointing out that fabulous companies with very bright prospects (like AAPL, MSFT, NVDA) are not cheap at all. Sure, they’re a lot less expensive than they were in 2021, but they are NOT cheap……The same is true for some of the hardest hit stocks of 2022. For instance, PYPL and NFLX are not cheap by any historical standard. And there is one thing that is for sure, none of these stocks have reached the cheap levels they did at the lows in late 2018…and not even close to the levels seen in 2008/09 or 2002/03.
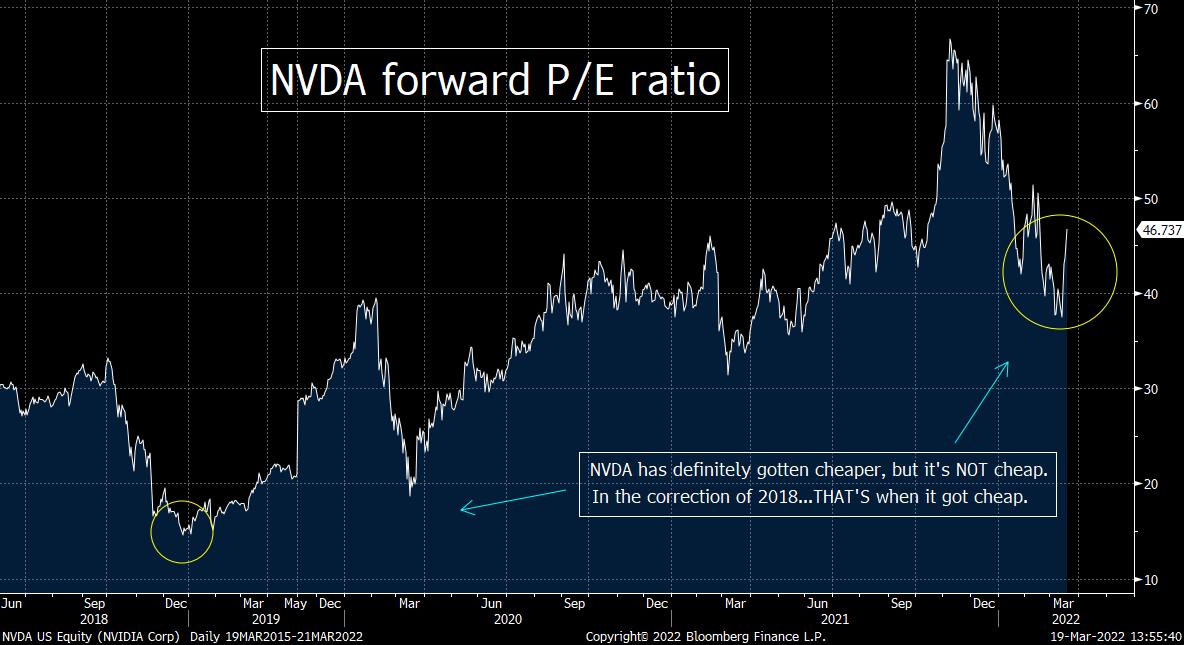
It is great to see that the forward multiple on NVDA has dropped to 46x from 66x (in Q4 of last year), but even its lowest P/E reading this year (when it hit 37x earlier this month) is higher than anything it saw before the Fed engaged in its historic QE program in 2020. Therefore, one cannot say that this stock of this company (as great as this company has become) is cheap…or even close to cheap. Heck, at the lows in 2018, NVDA was trading at 14x its forward earnings. Now THAT is cheap!!!......The same thing can be said about AAPL’s current forward multiple of 26. One would think this should be considered a very cheap stock at this level, but history says otherwise. Before the Fed stepped to the plate with its massive stimulus plan, the stock had been trading below 20x earnings for years……..As for MSFT, the same is true as well. Yes, it’s multiple has fallen from 36 to 31 (and a low of 29 earlier this month), but it had spent years below 25 before the Fed’s rescue plan was put into place.
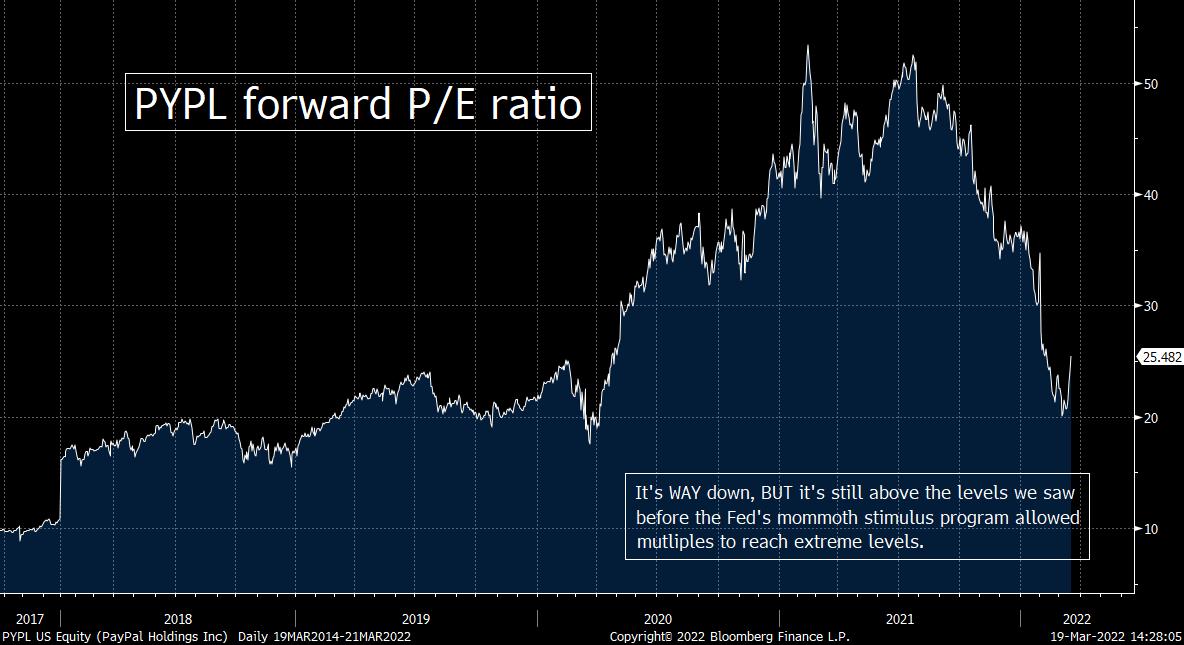
The same is true for many of the stocks that have been beaten down badly over the past several months. The 70% decline in PYPL since last July took its forward P/E from over 50x..down to 25x. That still puts it above anything it saw before March 2020 (when the Fed intervened in such a big way). In fact, the 20x level it reached earlier this month was still at the very high end of the years leading up to 2020……The same is true for NFLX. The 50% drop since November still has the stock trading at 33x forward earnings. Yep, that’s a lot lower than the 52x number is saw last fall, but that’s still well above the average we saw before the Fed implemented its huge QE program in Q1 2020……Even some of the newer companies can not be consider cheap after substantial declines. Just look at Draftkings (DKNG). The stock fell 78%...and yet it’s forward P/E only fell to……Oops, they don’t have any earnings. Oh well.
The point we’re trying to make is that the Fed’s mammoth stimulus program…that saved the financial system from locking down during the pandemic (which is NOT an exaggeration)…also pushed valuation levels to the kinds of extremes that cannot be maintained without that vast level of liquidity. Sure, ultra-low interest rates did justify at someelevation of those multiples (at least theoretically), but not the kind that we saw throughout most of 2021. Therefore, the fact that they have come down a lot DOES NOT make them cheap. In our opinion, we’re going to have to reach the kind of valuation levels that were more in-line with the average of several years before the pandemic (at least) before we can look at the stock market as a “great” buying opportunity. (“Cheaper” does not = “cheap.”)
Let’s look at it this way: If a man is 6 feet tall and weighs 350 pounds…and loses 50 pounds…he WILL be lighter. However, he will still want to lose more pounds before he considers himself at a healthy weight. Losing 50 pounds would be a fabulous accomplishment, but remaining at 6 feet tall and weighing 300 pounds would still not be enough to reach the goal of a healthy weight for most men……The same is true for stocks. Just because they have worked off some of the extremes in terms of of valuation, it does not mean that they’re cheap enough (healthy enough) to make them a great buying opportunity.
5) One of the misnomers that came out of last week was that the stock market in general…and the tech stocks in particular…were “massively” oversold early in the week. Well, they were somewhat oversold on a very-short-term basis, BUT they were not massively oversold. In fact, they weren’t particularly oversold on an intermediate-term basis at all…and not even close to where they stood at the 2020 and 2018 lows! Therefore, we do not believe last week’s bounce will be as strong…or last as long…as many pundits indicated last week.
There is absolutely no question that the stock market “seemed” like it was flat on its back last Monday…after yet another rough day in the stock market. However, as painful as the 13% drop in the S&P 500 from its all-time highs and the 20% drop in the Nasdaq felt by last Monday afternoon, it paled in comparison to the much strong drops we experienced at the lows in 2020, 2008, or even 2018 (at least for the S&P 500 in that last example).
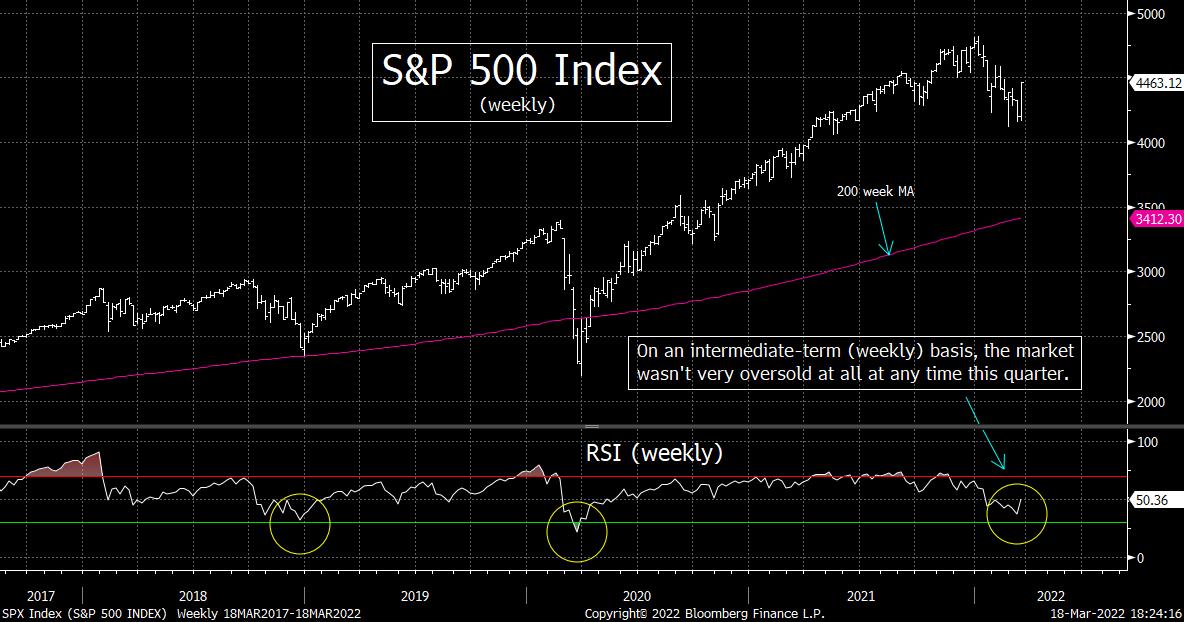
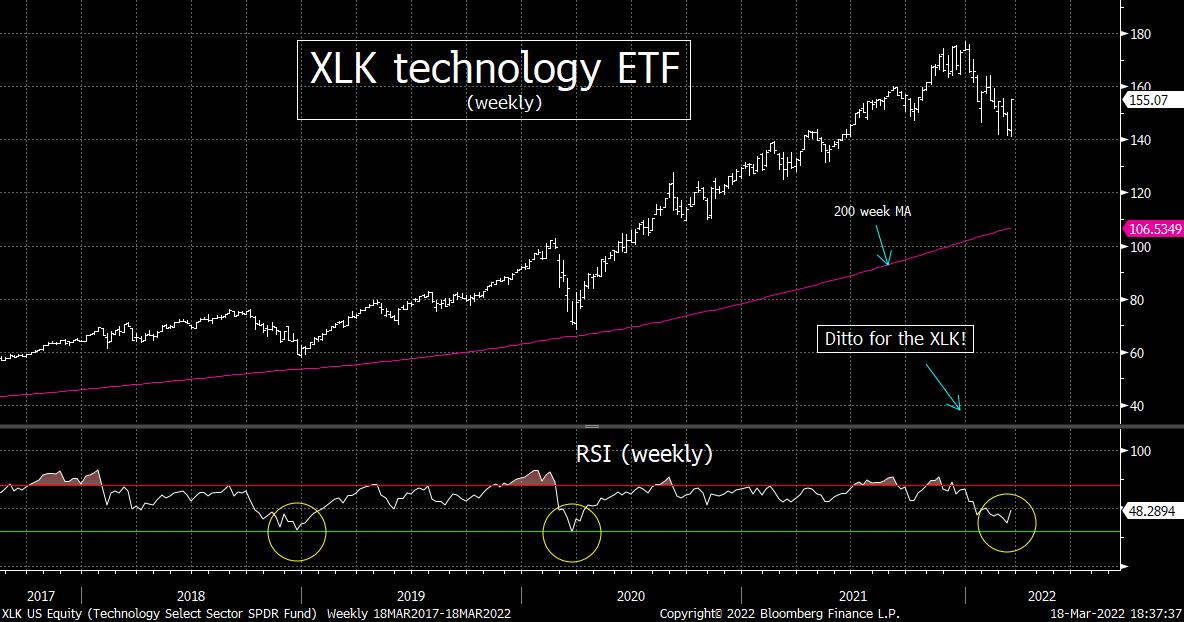
Also, despite what some pundits try to say last week, the broad indices, the tech ETFs and most of the key leadership stocks in the market had not become “massively” oversold. Yes, if you look at their RSI charts, some individual names had indeed become oversold, but they were not as oversold as they have been at other important bottoms…and the broad indices and tech ETF’s were not very oversold at all on their intermediate-term (weekly) RSI charts!
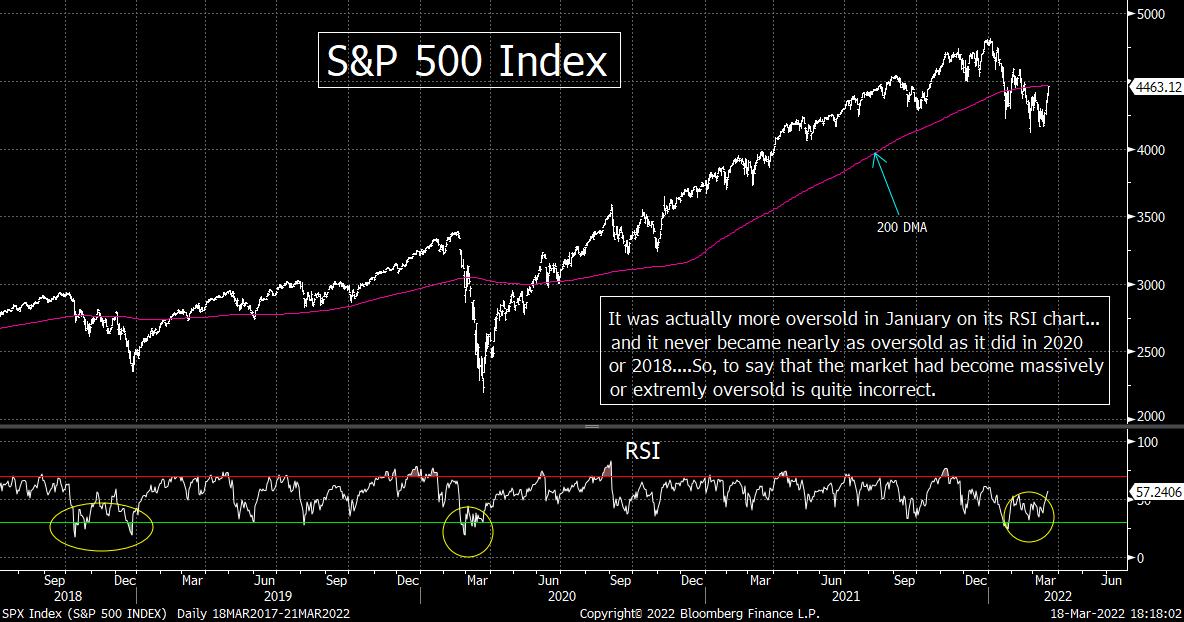
Let’s start with the broad indices. The RSI on both the S&P 500 and NDX 100 only fell to 34 at its lowest level this month. This compares to reading of 19 in 2020 and 17 in 2018 for the S&P…and 26 and 24 for 2020 & 2018 respectively for the NDX. So, these two key indices never came close to the same kind of oversold level they reached at the last two important bottoms.…….Similarly, on the weekly RSI chart, the SPX fell to only 37 at its March low…vs. a reading of 27 in 2020 and 31 in 2018. For the NDX, those weekly RSI readings were 33 this month…vs. 29 and 31 in 2020 and 2018…..Therefore, although SOME (not all) of those daily RSI readings were getting somewhat near oversold levels, none of the weekly ones were last week….and NONE of them (daily or weekly) was close to the levels that signaled a bottom for the last two deep declines in the stock market. (The daily & weekly RSI chart for the S&P are attached below. The NDX charts are very similar, but we didn’t want to inundate you with too many charts in one bullet point.)
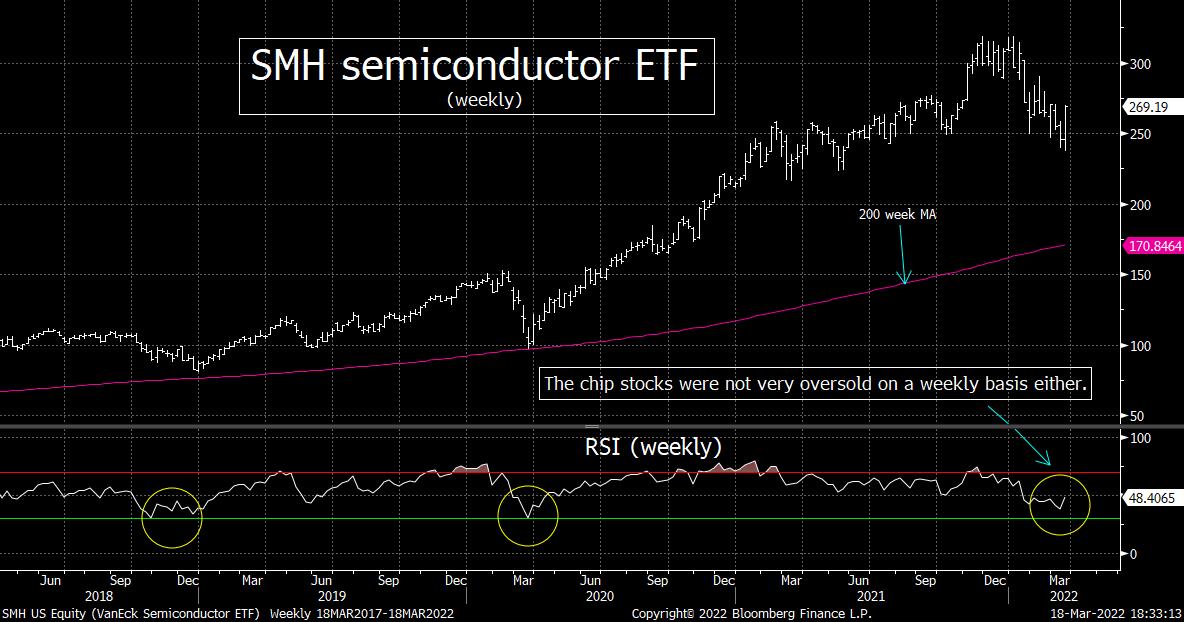
Sure, there were A FEW stocks that become extremely oversold (especially the China related stocks), but as you can see from the 3rd and 4th charts below, neither the XLK technology ETF nor the SMH semiconductor ETF reached the kind of oversold conditions that helped create a lasting rally at the bottom of the declines in 2020 or 2018. Therefore, even though the tech sector has been kicked in the teeth this year, the technical condition of this sector was not as bad at the beginning of last week as many pundits have tied to portray. Thus, this is another reason to think any near-term bounce will not last a lot longer.
Having said all this, we DO need to admit that sentiment HAD become quite bearish…something we’ve pointed out several times in recent weeks. Therefore, we are not trying to say that there is no chance that the market will see some more upside follow-through in the coming weeks. (In fact, as we pointed out in a previous bullet point, a further rally is definitely possible.) However, we do not think that THE bottom has been put-in for this decline. When that bottom is finally put in place, the market should reach a much more oversold condition than it did on Monday of last week…and as we said in the previous point, it should reach a much cheaper valuation level as well.
6) Another important point to make when it comes to trying to decipher if we’ve seen THE bottom or not for this decline…is to note that many important market declines (multi-month or longer ones)…tend to end with an important “new development.” Yes, sometimes a bear market or deep correction can just fizzle-out on its own, but it usually bottoms when an positive catalyst actually CREATES the a bottom. We haven’t gotten that type of catalyst yet.
There have been times when a bear market or a serious correction just fizzle-out. The selling becomes exhausted (frequently after some sort to “capitulation” move where “forced selling” becomes heavy). In other words, a big bout of “forced selling” leaves the market in a situation where there is nobody left to sell. This is what took place in early 2016…..However, this is not always the case. Sometimes…and a lot more often than people realize…we have NEEDED some sort of new positive development to create the bottom. Without t
Recent free content from Matt Maley
-
 THE WEEKLY TOP 10
— 10/23/22
-
 Morning Comment: Can the Treasury market actually give the stock market some relief soon?
— 10/21/22
-
 What Do 2022 and 1987 Have in Common?
— 10/19/22
-
 Morning Comment: Which is it? Is stimulus bullish or bearish for the stock market?
— 10/17/22
-
 Morning Comment: Peak Inflation is Becoming a Process Instead of a Turning Point
— 10/13/22
-
{[comment.author.username]} {[comment.author.username]} — Marketfy Staff — Maven — Member


