Overview
Equity indices retreated modestly this week and remain close to their highs, but a fair amount of technical damage has occurred with significant levels breached on some of the major indices, and rapidly deteriorating breadth.
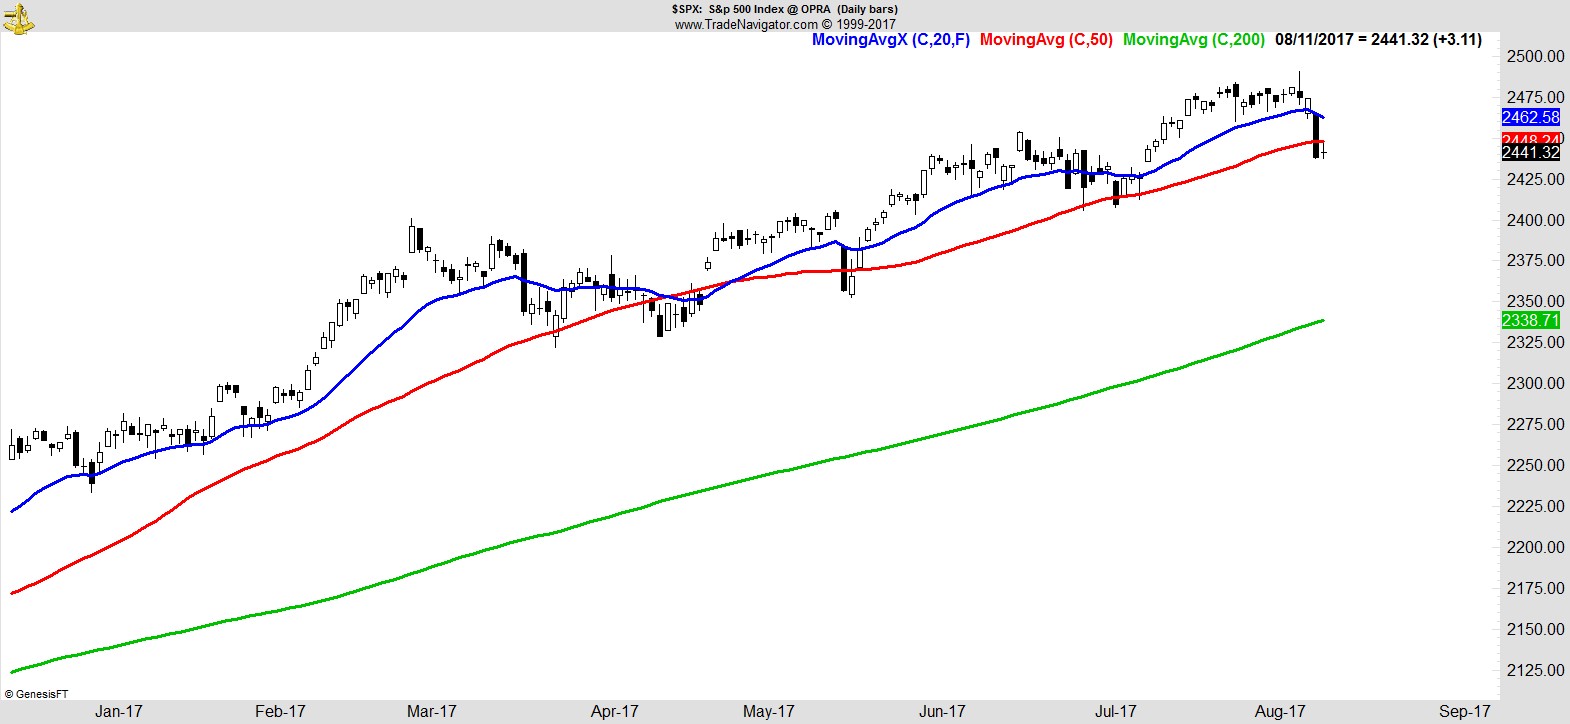
The S&P moved to 4 week lows, breaking below its 50-day MA, (and 10-week) but is just 1.6% off all time highs.
.
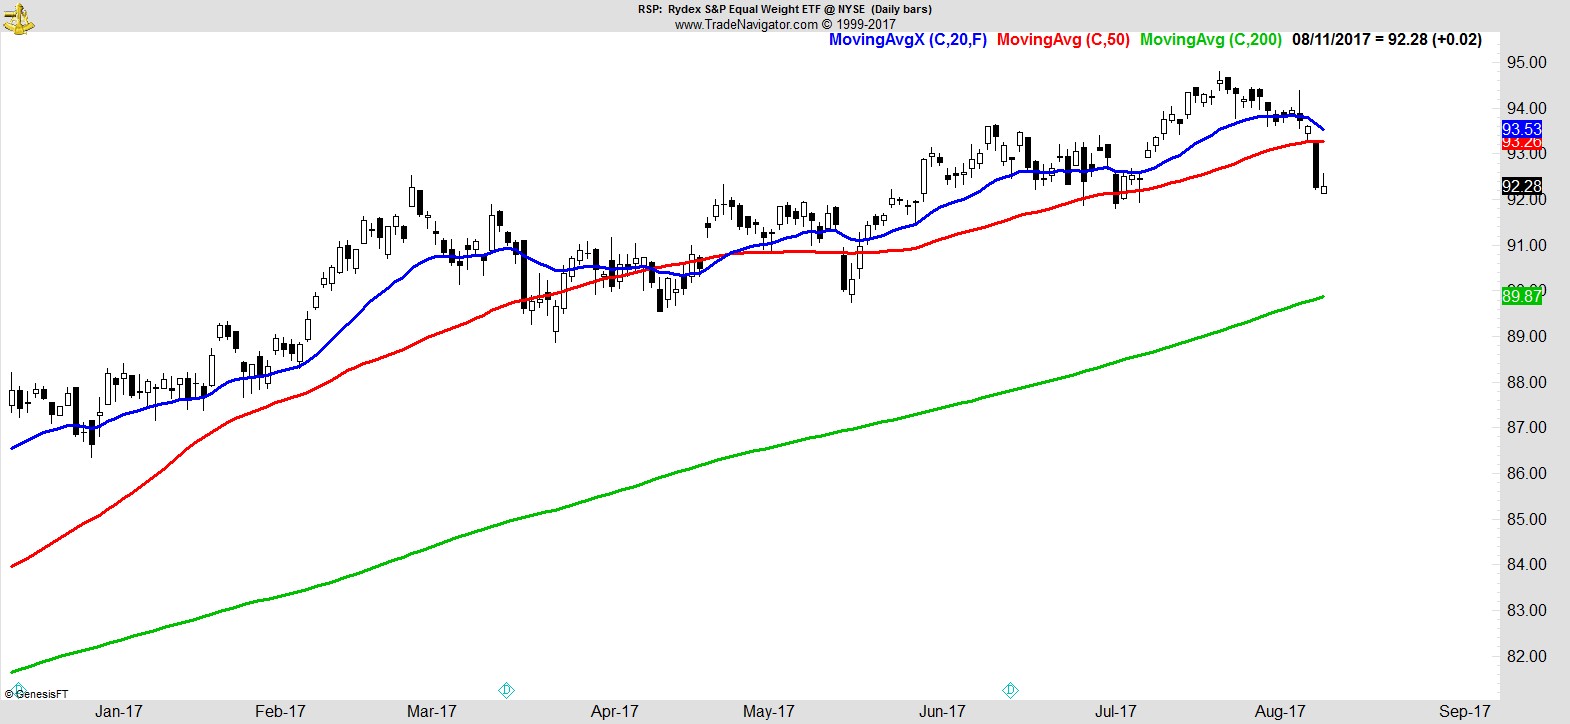
The equal-weight S&P (RSP) moved lower still, as leadership remains concentrated in smaller numbers of large cap names.
.
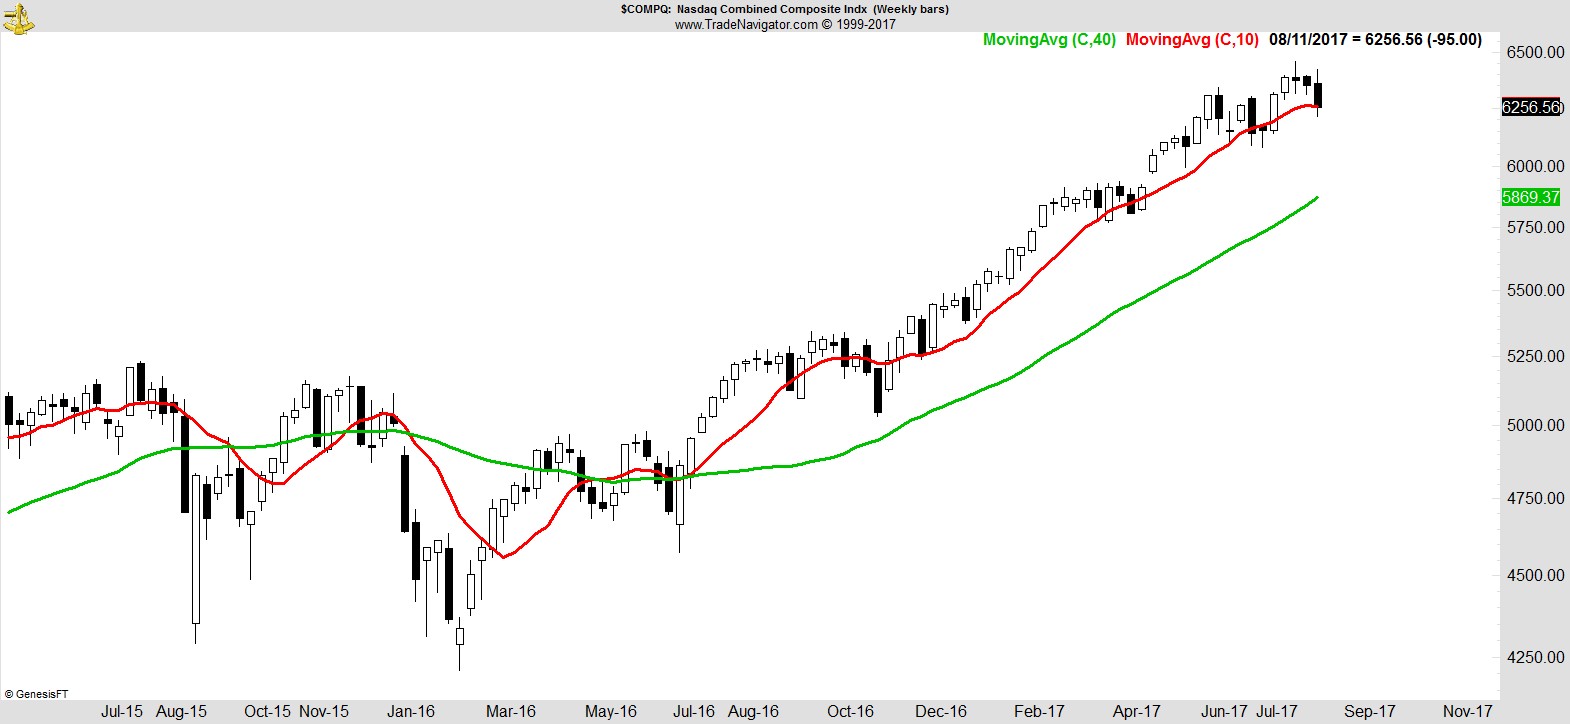
The NASDAQ closed marginally below its 10-wk MA.
.
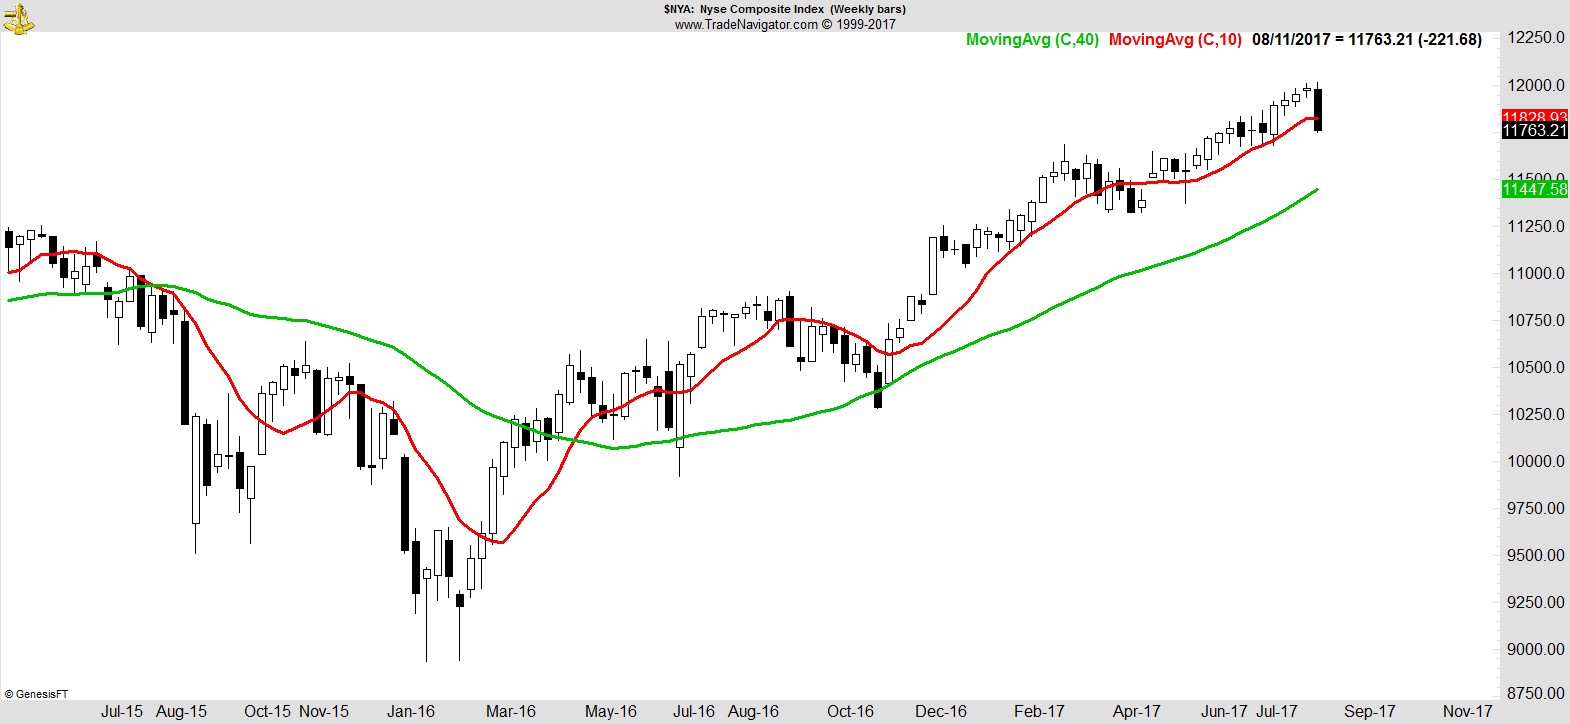
The NYSE Composite gave back 4 weeks of gains, slumping below its 10-week MA.
.
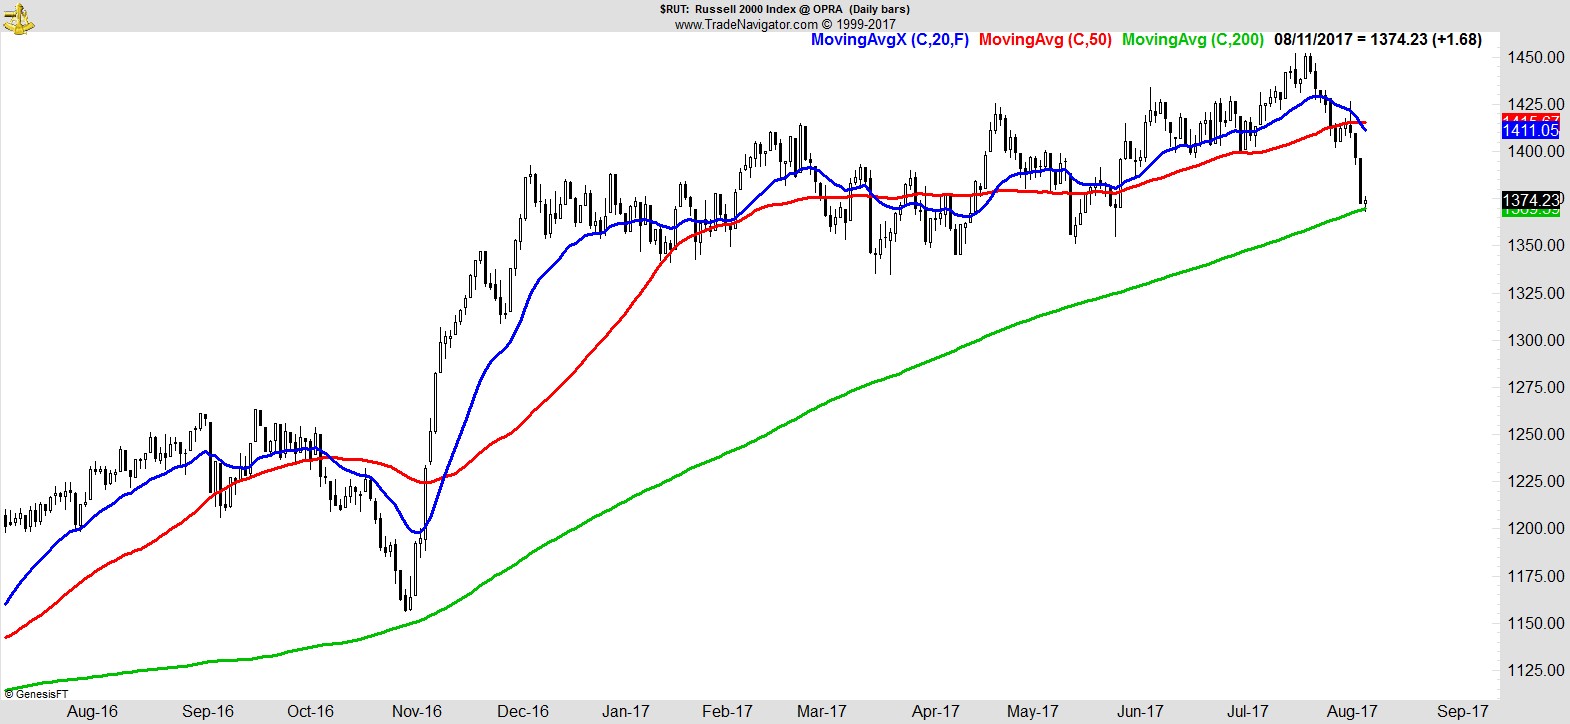
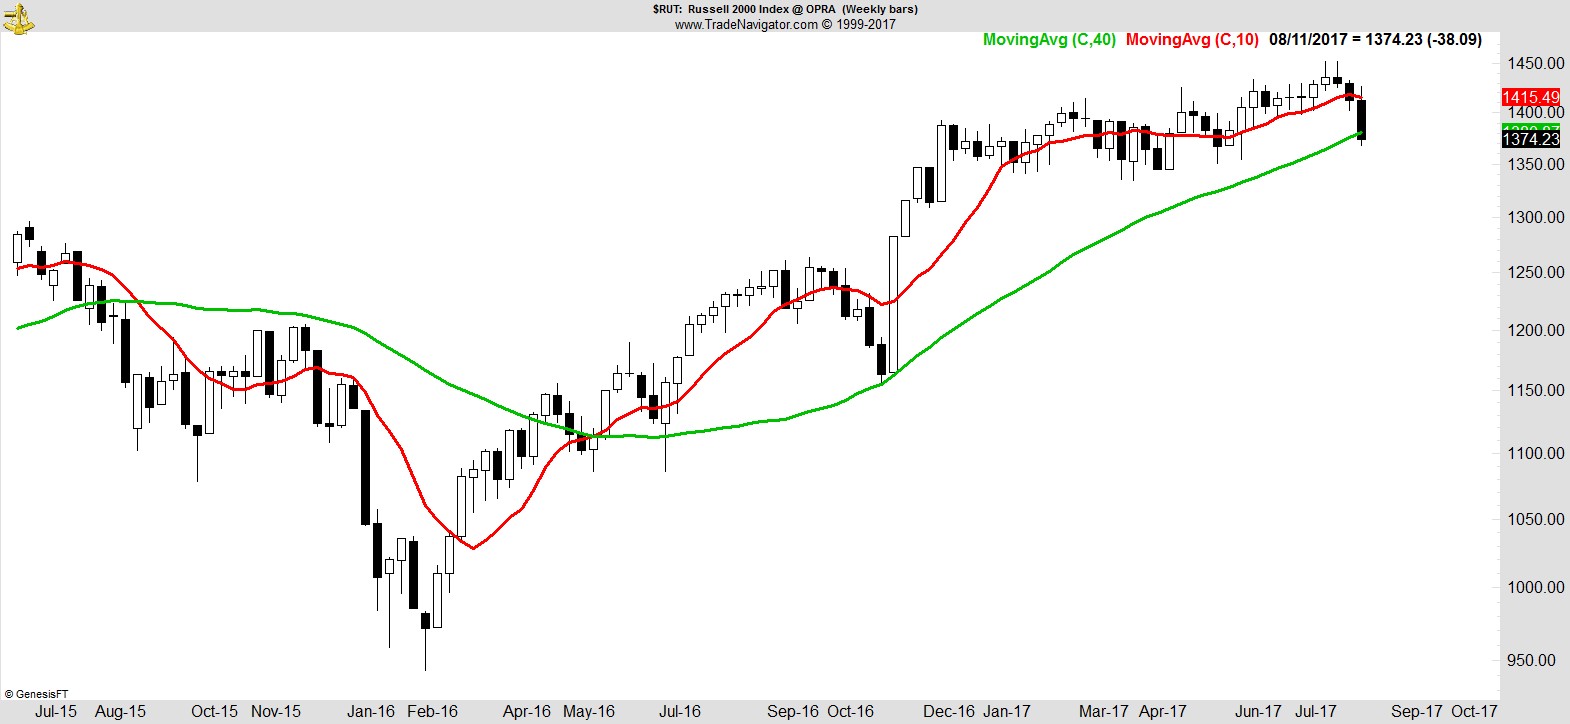
The Russell has pulled back to its 200-day MA, and closed below its 40-week MA.
.
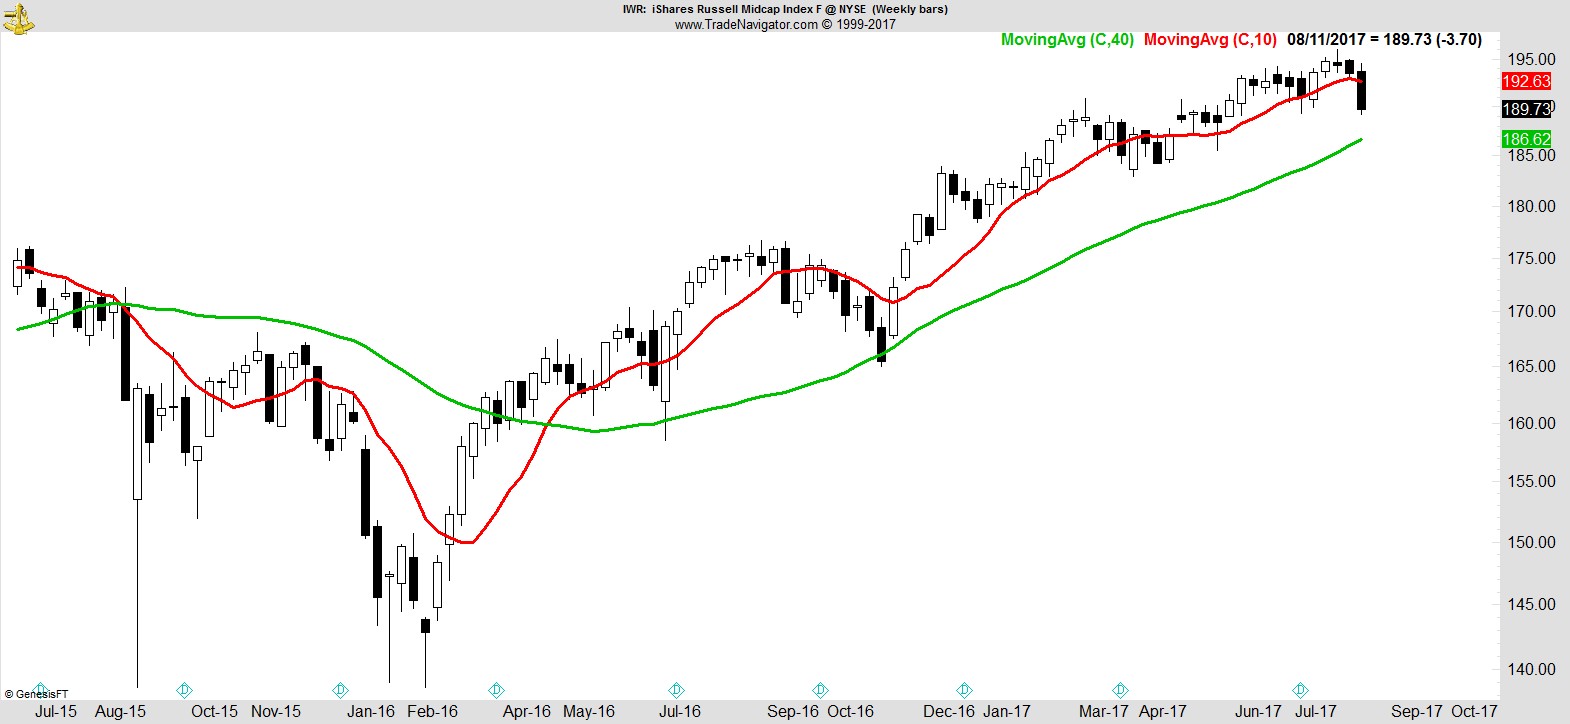
Midcaps posted the lowest weekly close in 3 months.
.
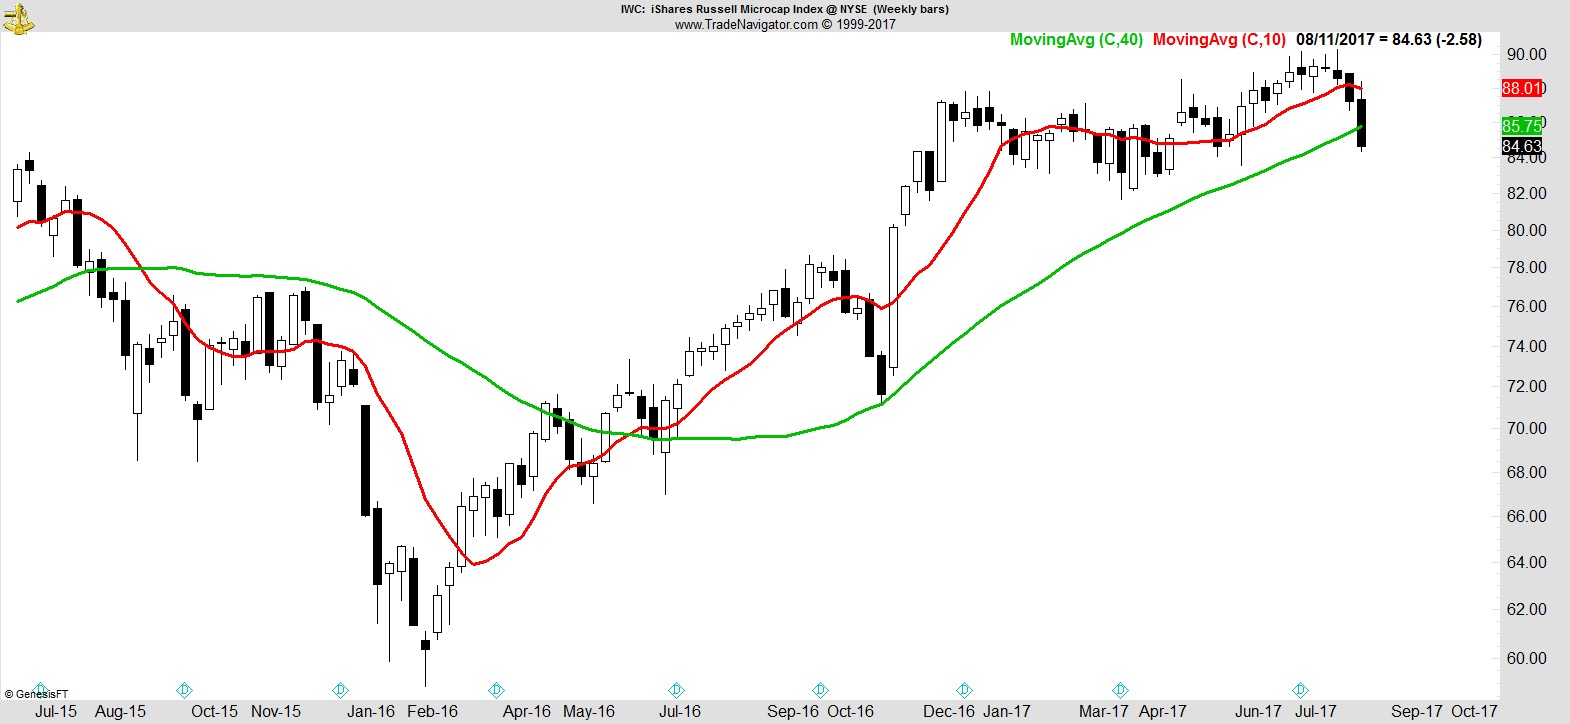
Microcaps closed lower for a third straight week, taking out its 40-week MA.
.
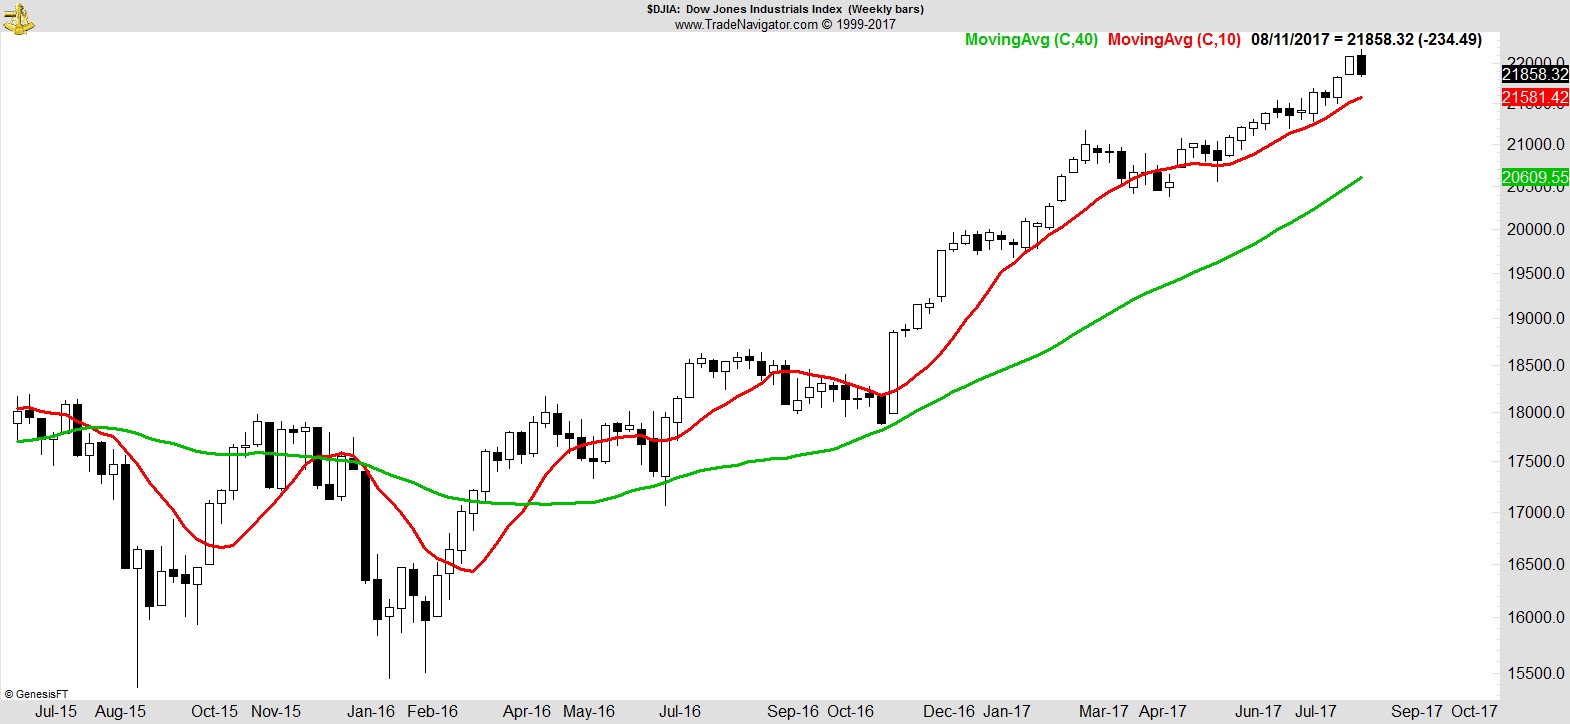
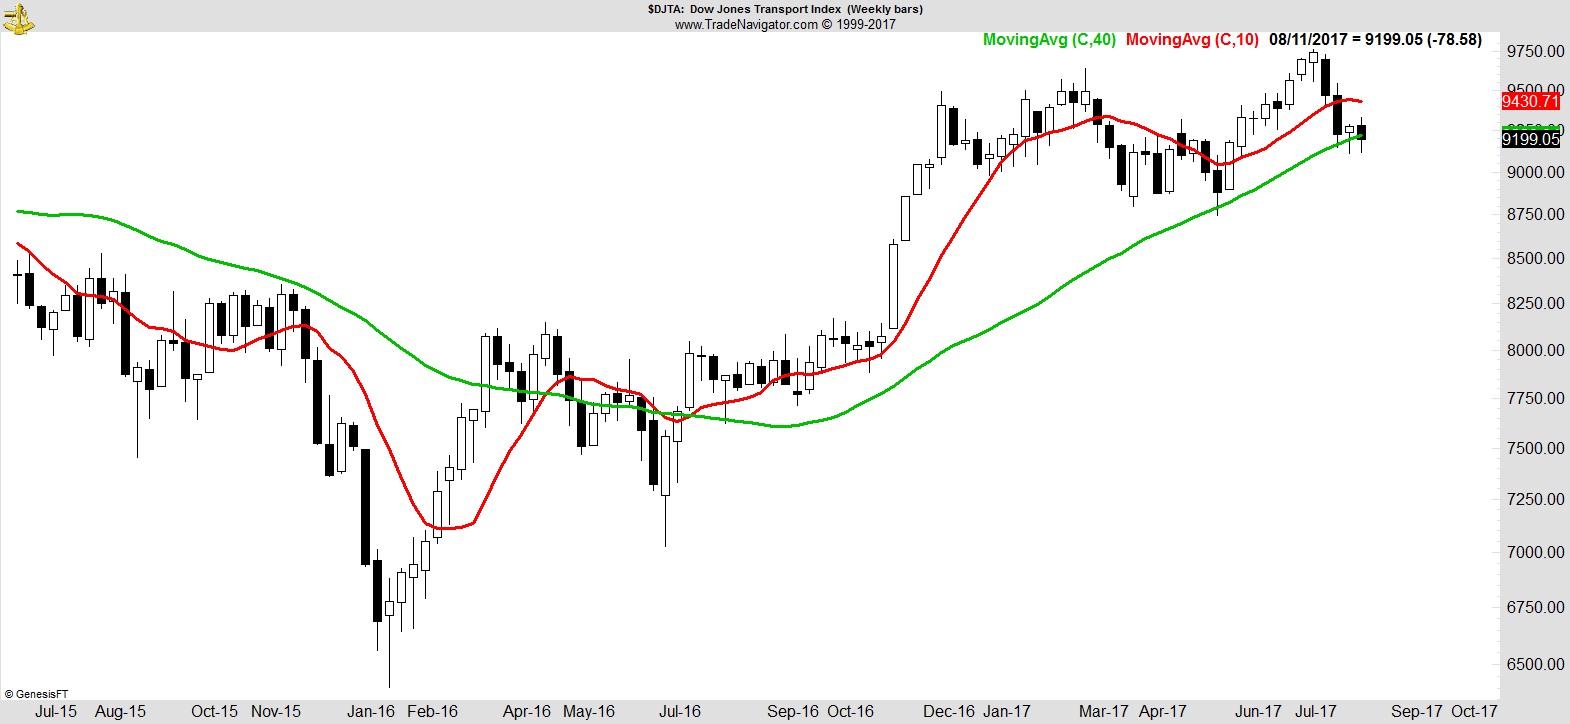
The Dow is easily the strongest of the major indices, just below its highs and with room to its 10-week MA, in sharp contrast to the Dow Transports which is testing its 40-week and 200-day MA.
.
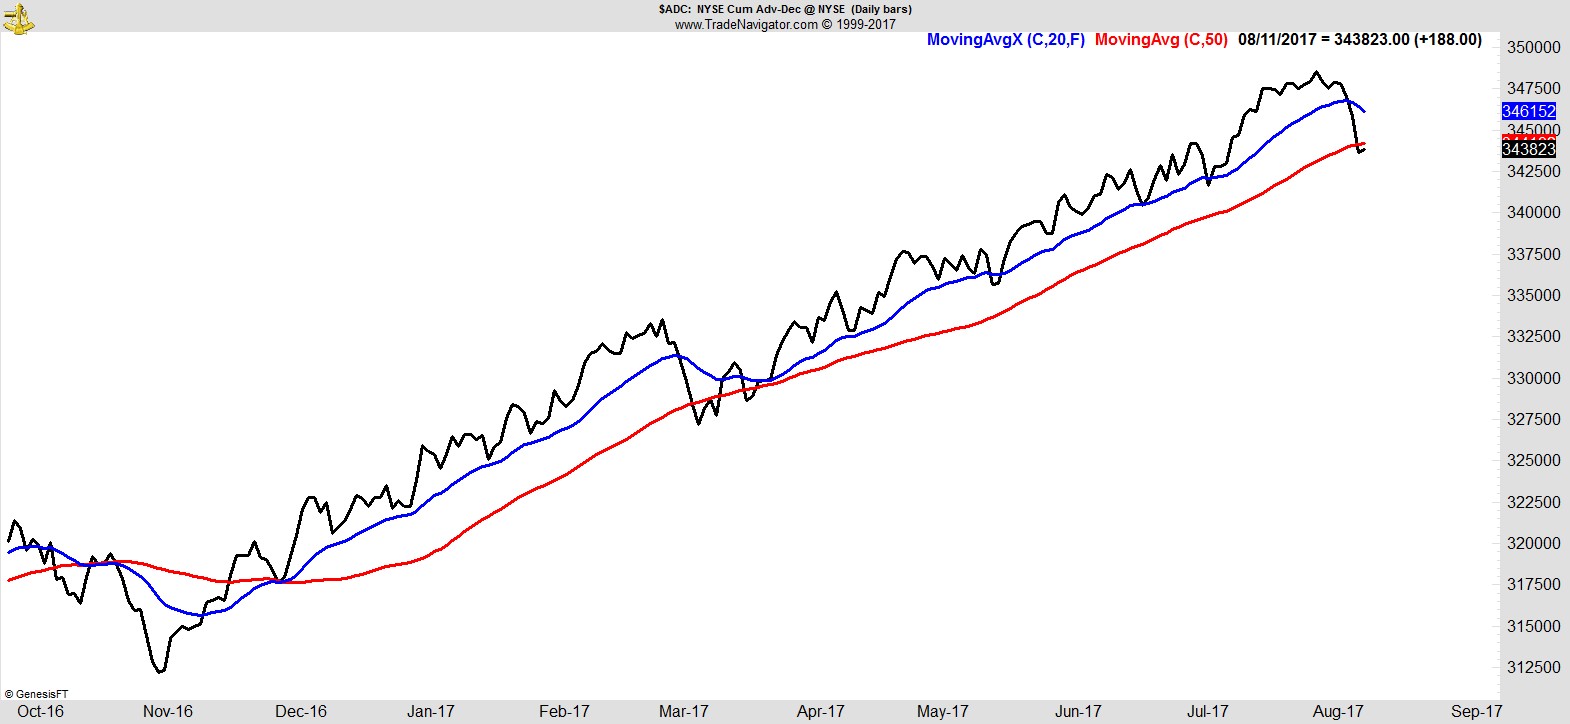
Breadth via the NYSE Cumulative Advance/Decline has retreated sharply.
.
Sector Analysis
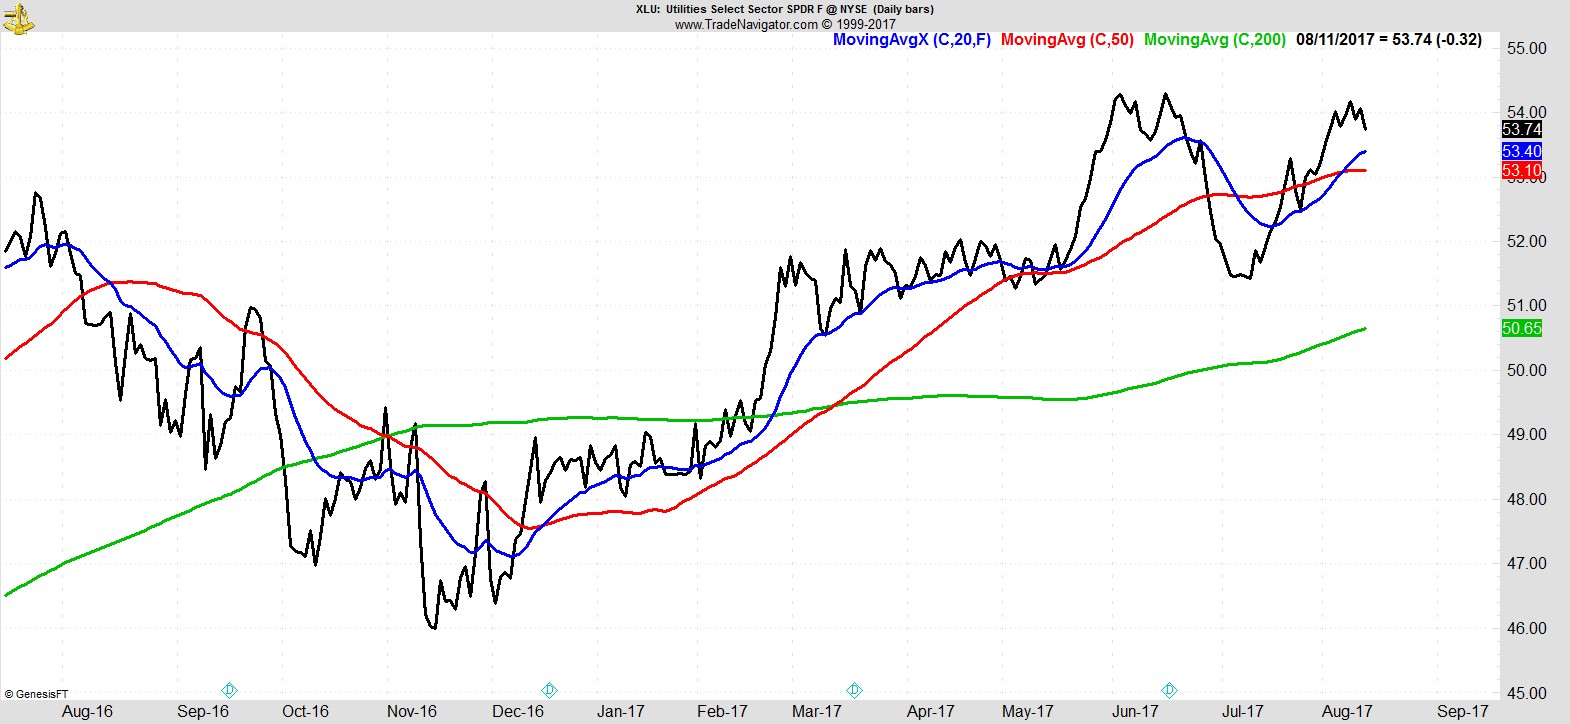
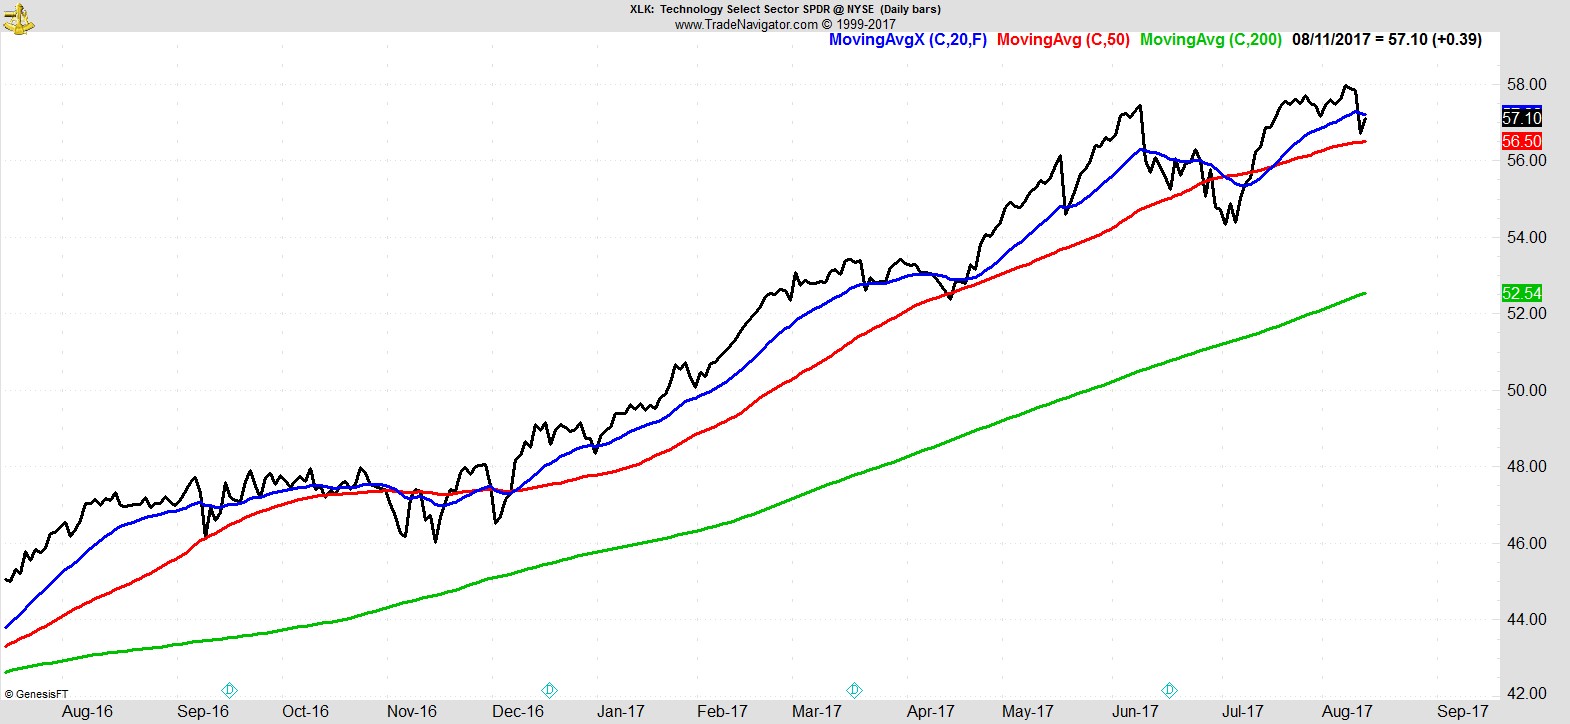
Utilities is the leading sector, and the only one of the ten S&P Sector SPDRs above its 20, 50, and 200-day MA. It's followed by Technology, which rallied on Friday in a partial recovery of Thursday's losses, to stay above its 50-day.
.
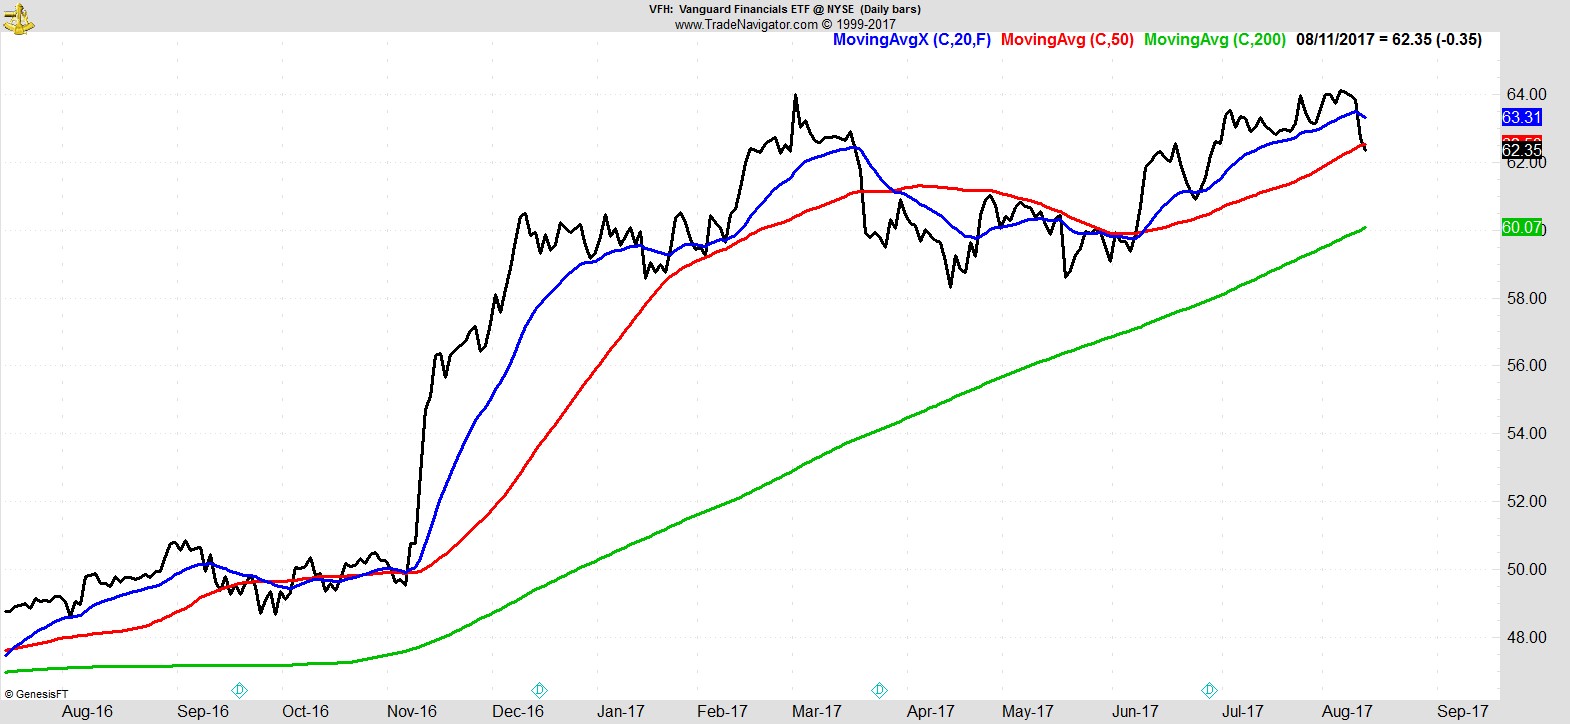
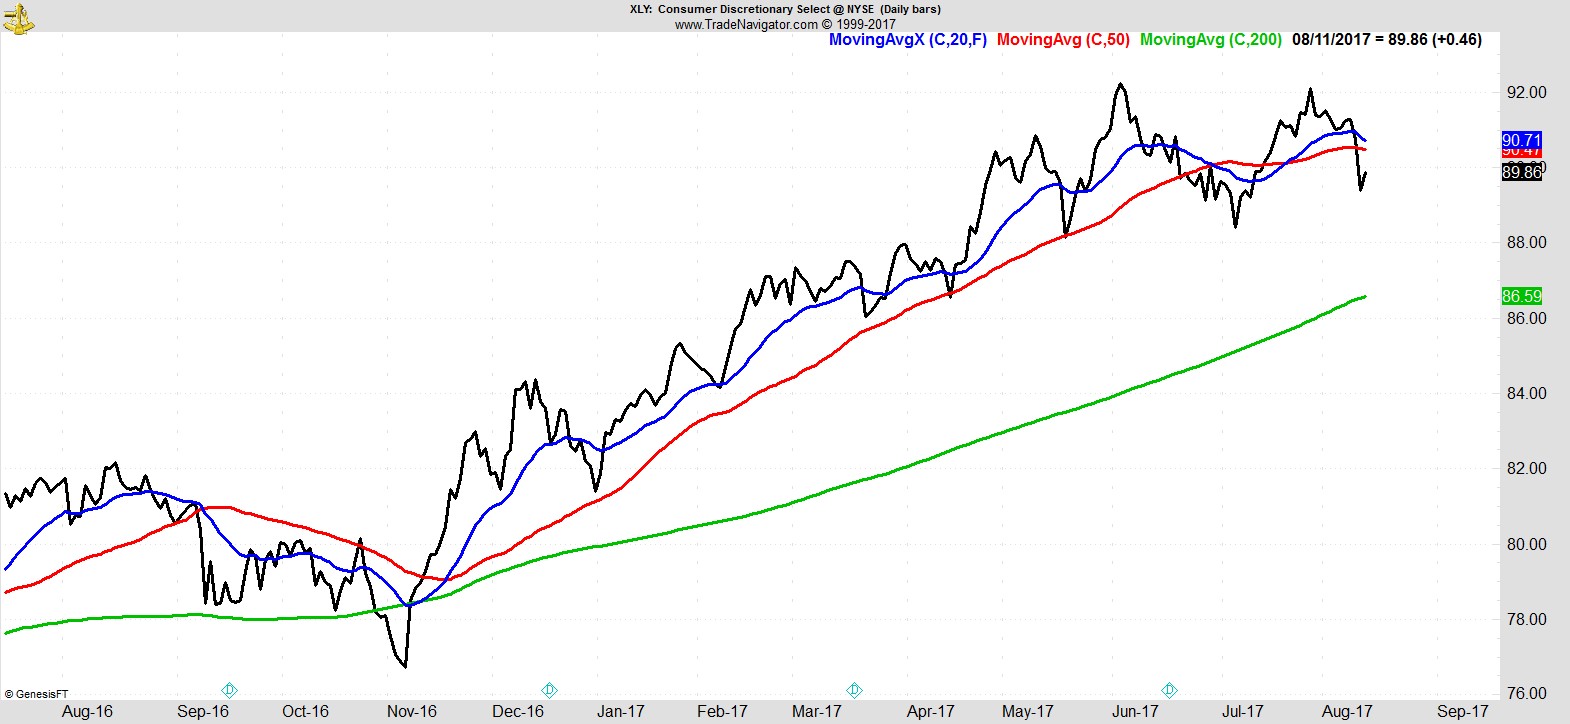
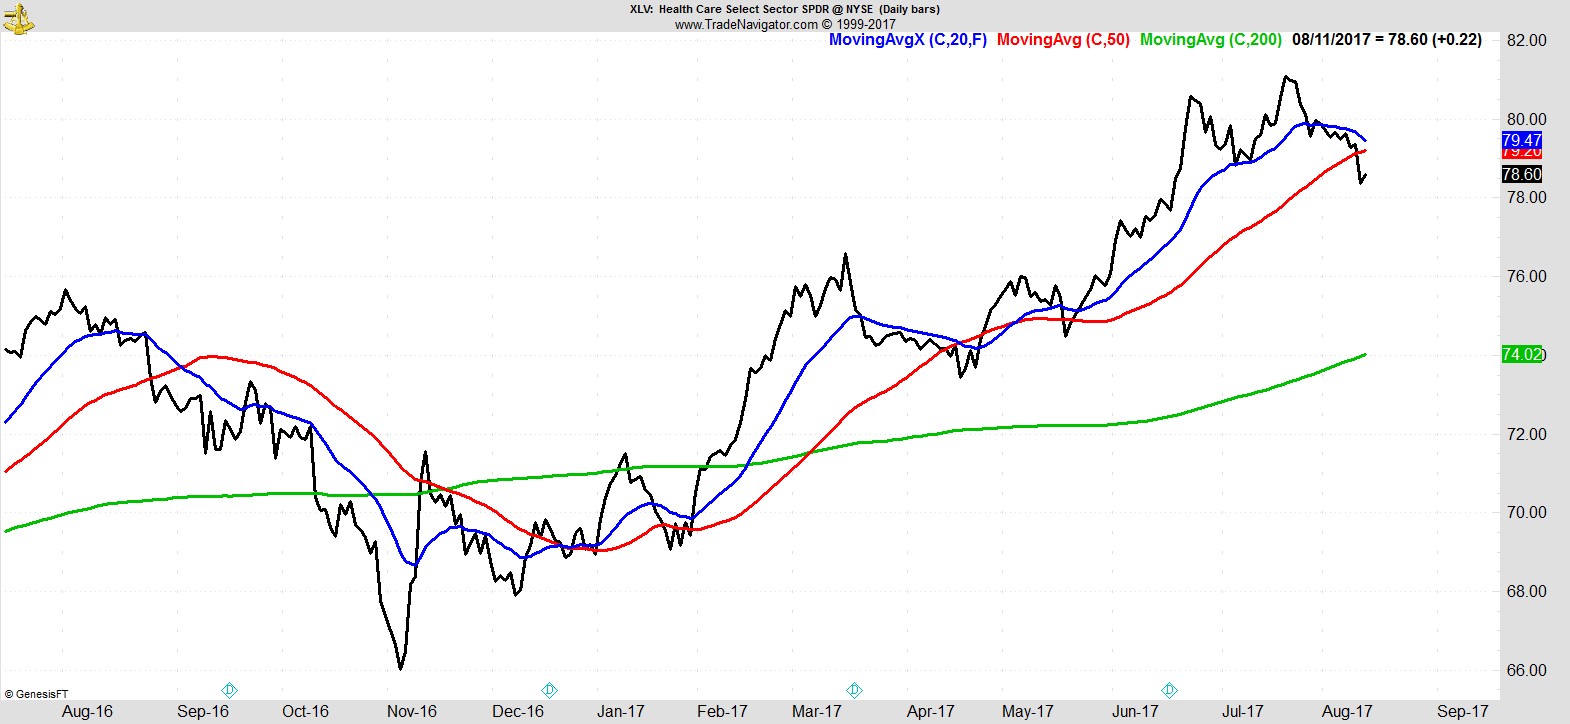
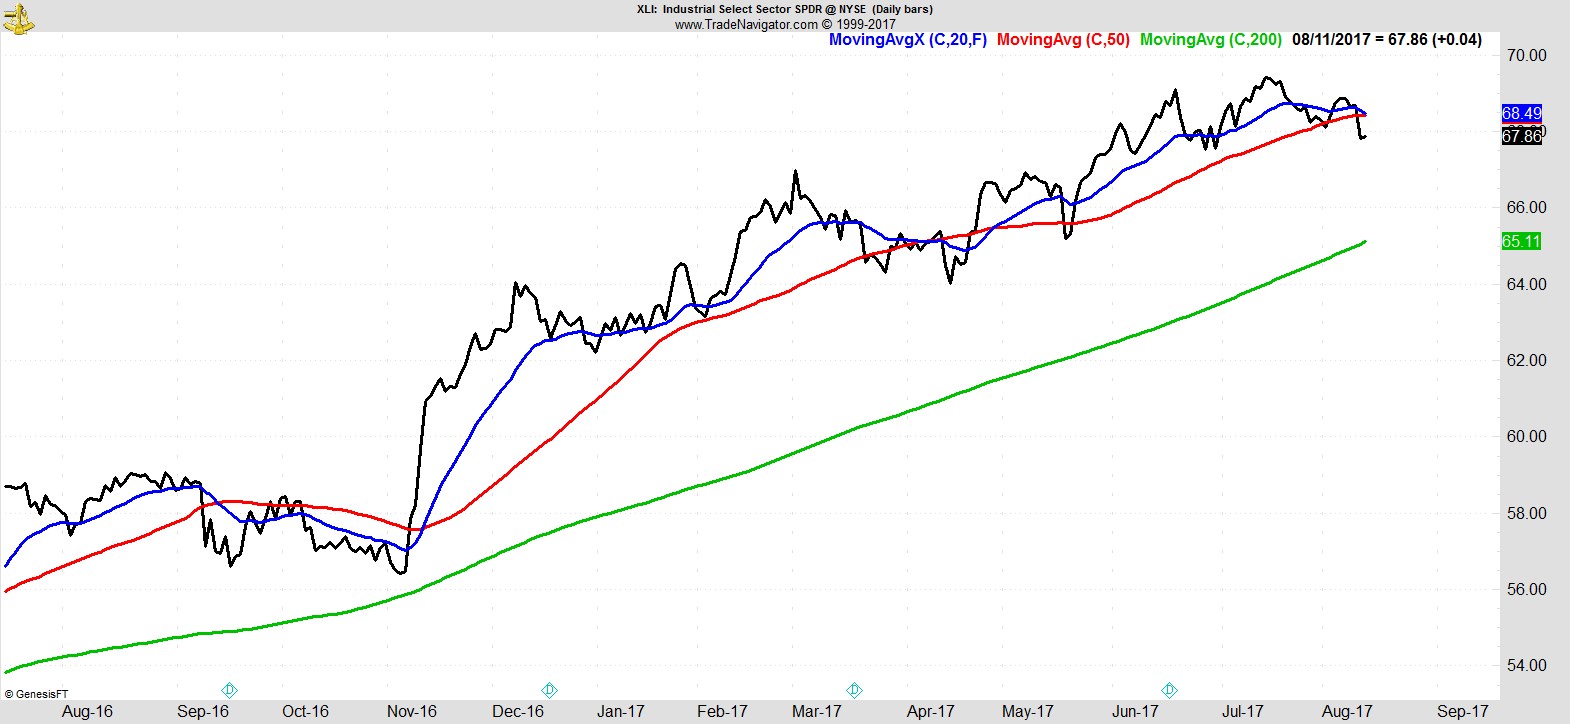
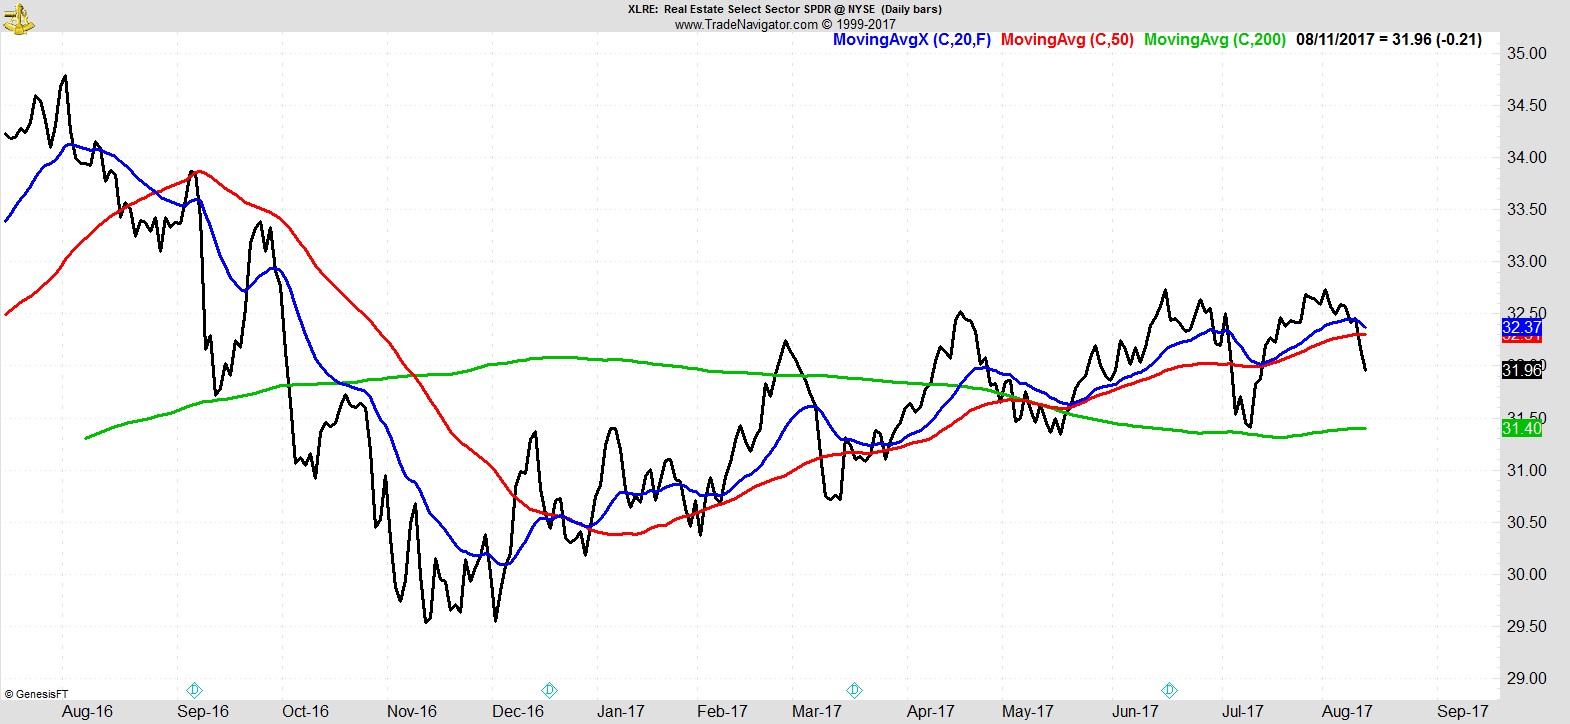
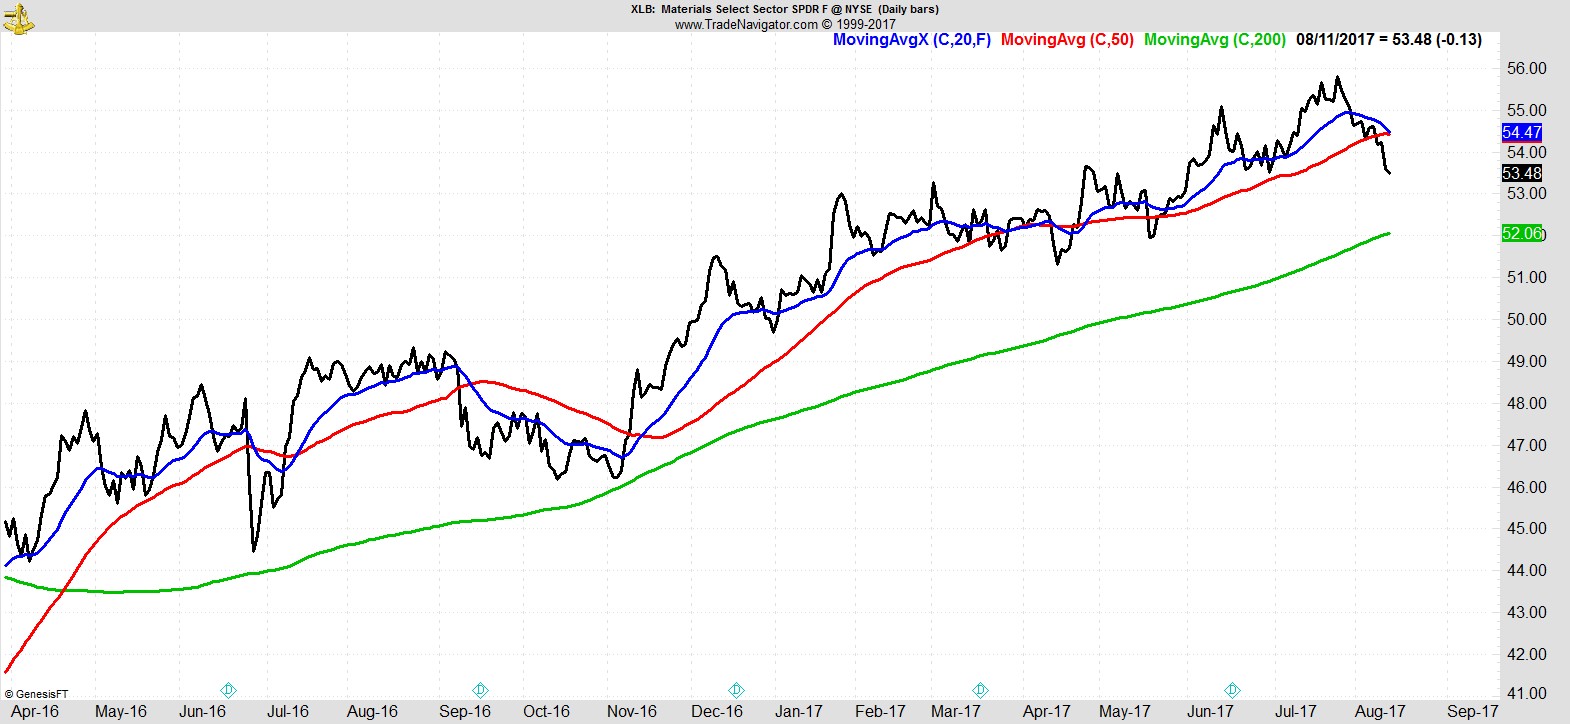
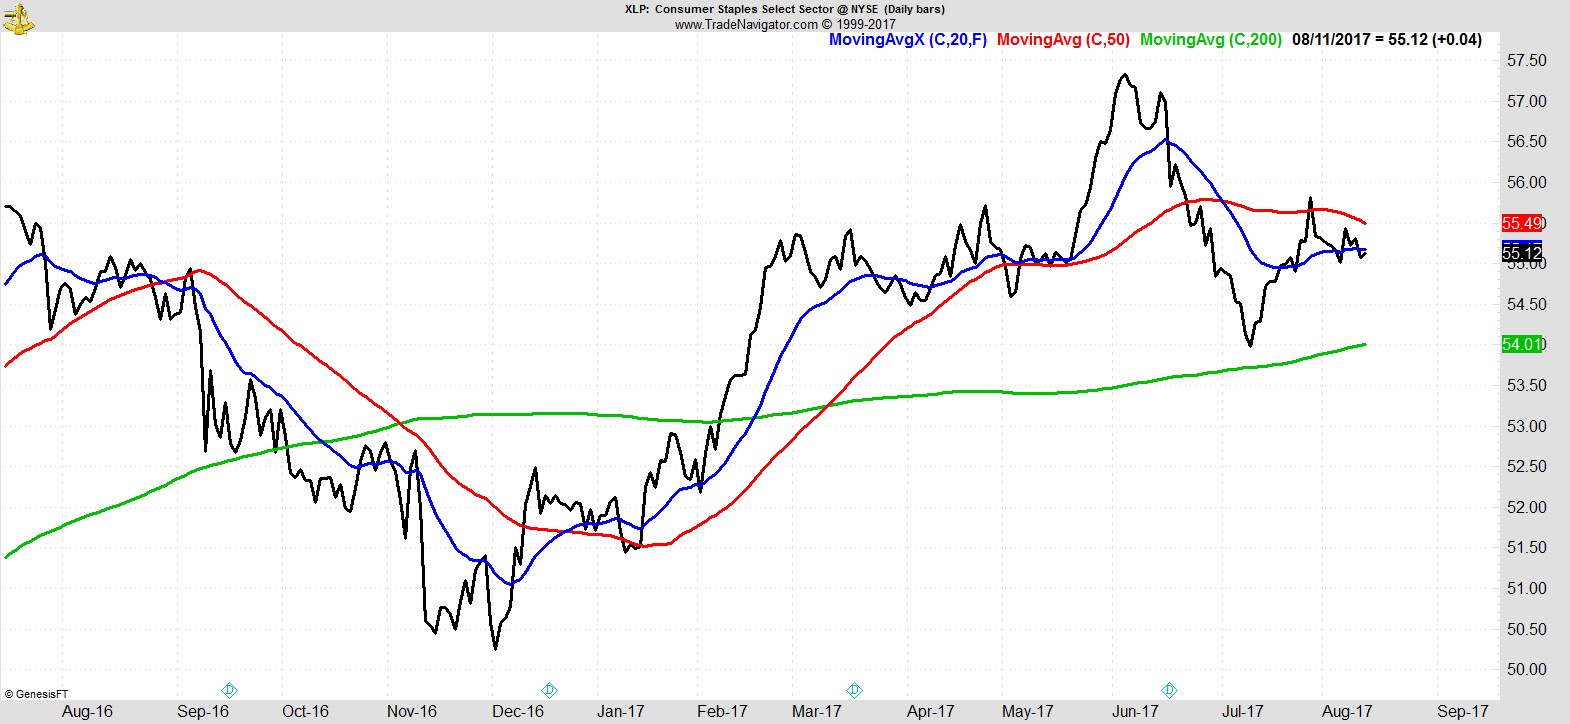
Then comes Financials, Consumer Discretionary, Healthcare, Industrials, Real Estate, Materials, and Staples, which are in long-term uptrends, but have all come under pressure recently, breaking below their 50-day MA.
.
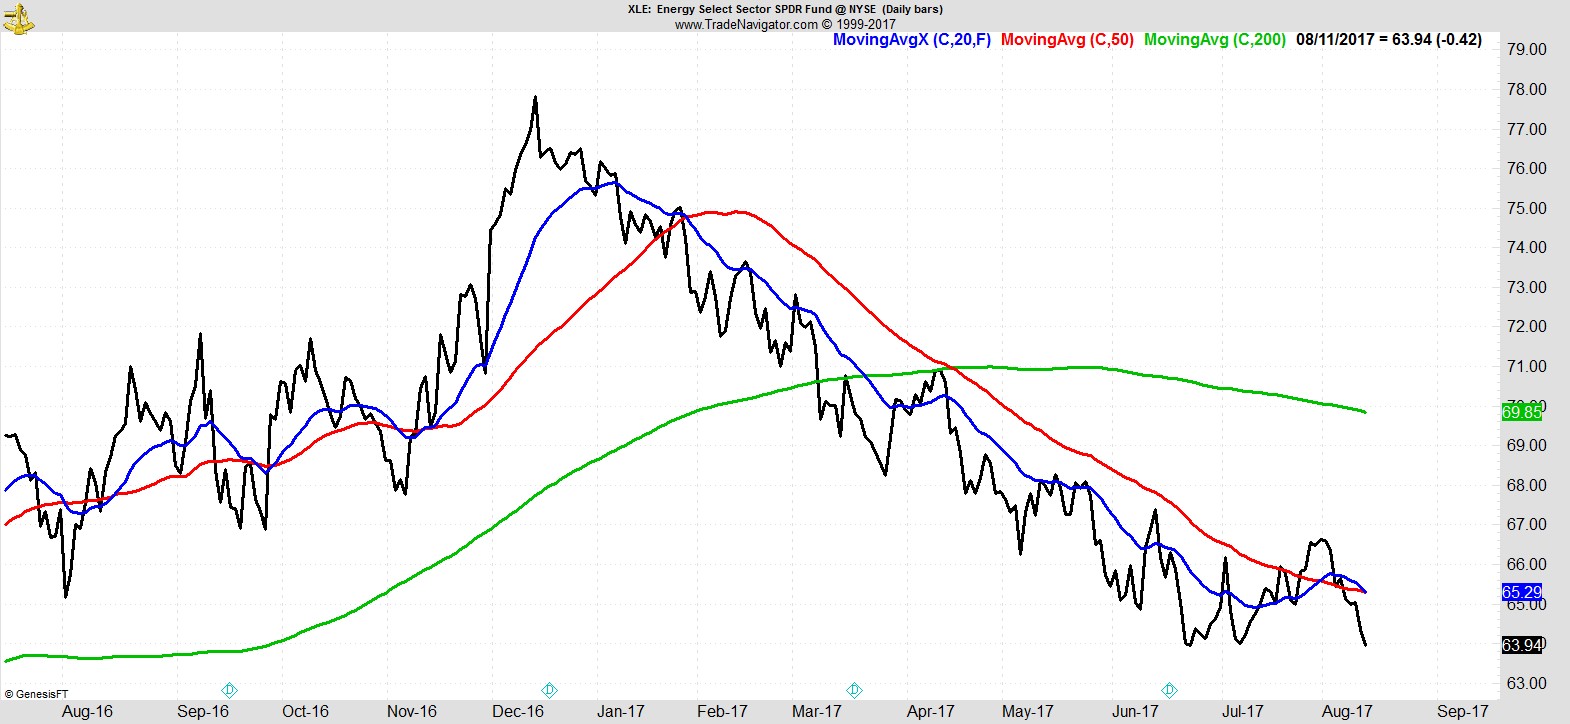
Energy remains bottom. Once again it had looked as if an uptrend was finally underway, but this week it resumed downward, recording a new low.
.
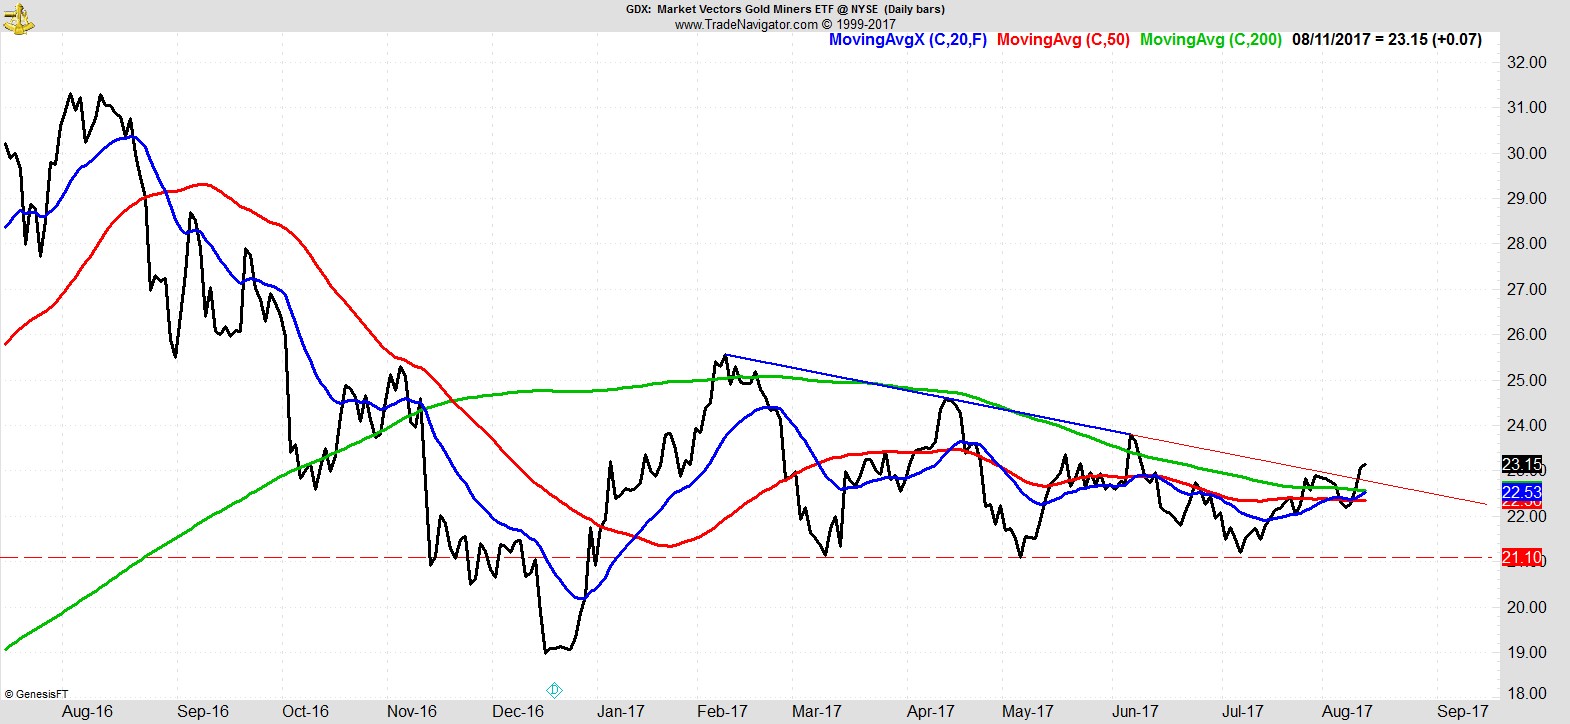
Away from the Sector SPDRs, the Gold Miners (GDX) chart continues to shape up well, even catching the attention of bond king and technician Jeff Gundlach.
"You need a magnifying glass, but GDX breaking out of a textbook six month pennant formation to the upside. Up day tomorrow would confirm it." — Jeffrey Gundlach (@TruthGundlach)
.
Alpha Capture Portfolio
Our model portfolio was -0.7% this week vs -1.4% for the S&P. It's now +0.8% YTD vs +9.0% for the S&P.
With further exits this week and no new entries, it's now down to just 5 positions, open risk of 2.5%, and 62% cash. The client portfolios I run, with slightly different timeframe and risk parameters, are in a similar situation with just 7 positions, 2.4% open risk, and 45% cash. They are +5.0% YTD.
We're in familiar territory with just a handful of positions, and plenty of cash. We saw this a lot during the 2015-16 bear where the market remained choppy and rangebound with long periods of sector rotation. Then as now, we'll continue to take what the market gives us.
We will either being well protected against any further weakness and will happily watch the market correct, hopefully severely with us long gone, or we will start to see breadth recover and new opportunities present themselves as the market moves to fresh highs with new leadership.
When the latter happens, repeatedly, it can sometimes feel like we're being punished for being prudent and managing risk. The reward longer-term is in avoiding the most severe downturns. The short-term underperformance that can result is the price we pay for that protection.
.
Watchlist
A reduced list this week. There have clearly been fewer good risk/reward opportunities in recent weeks, and if anything it has only got worse in the last few days, with the notable deterioration in breadth and continued relative weakness in small caps.
Here's a sample from the full list of 20 names:-
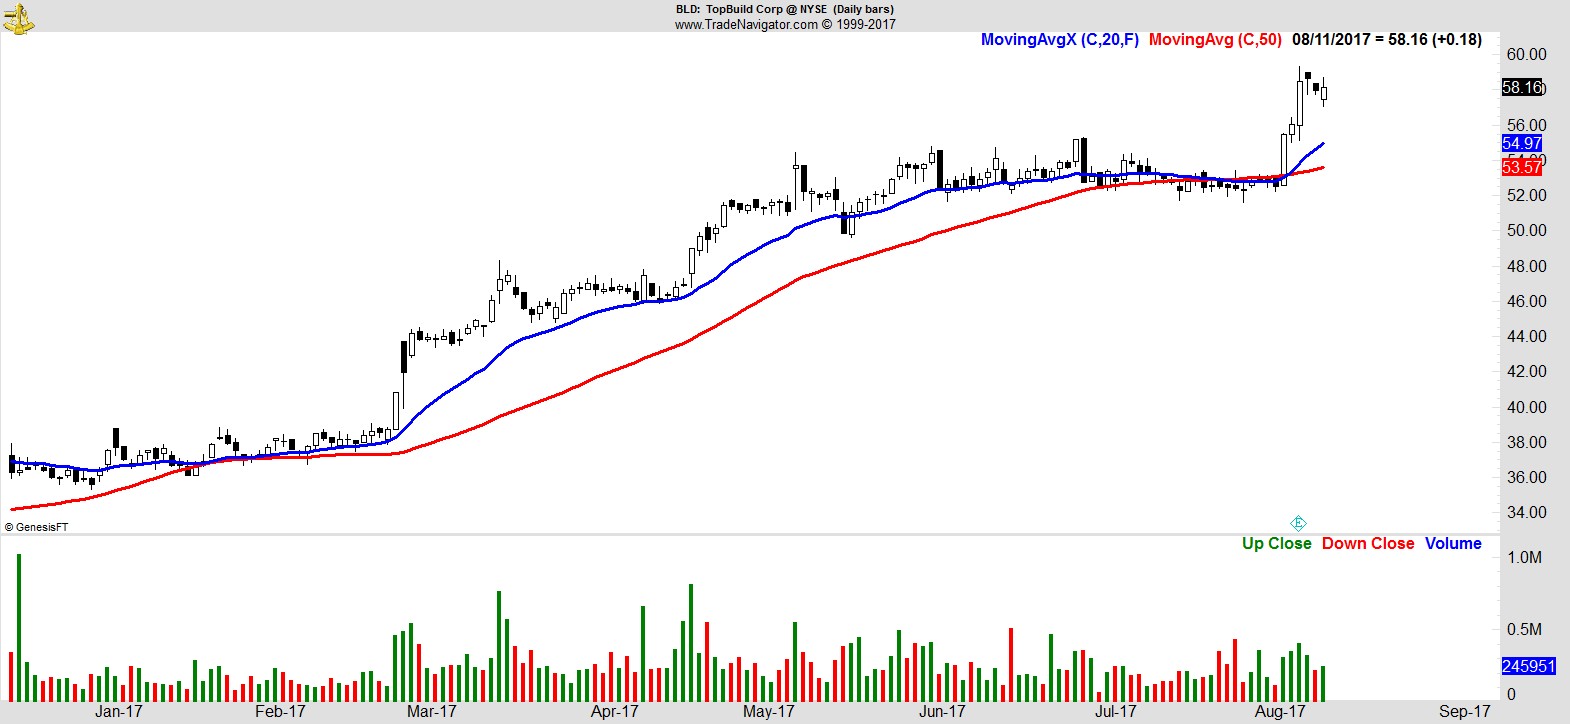
$BLD
.
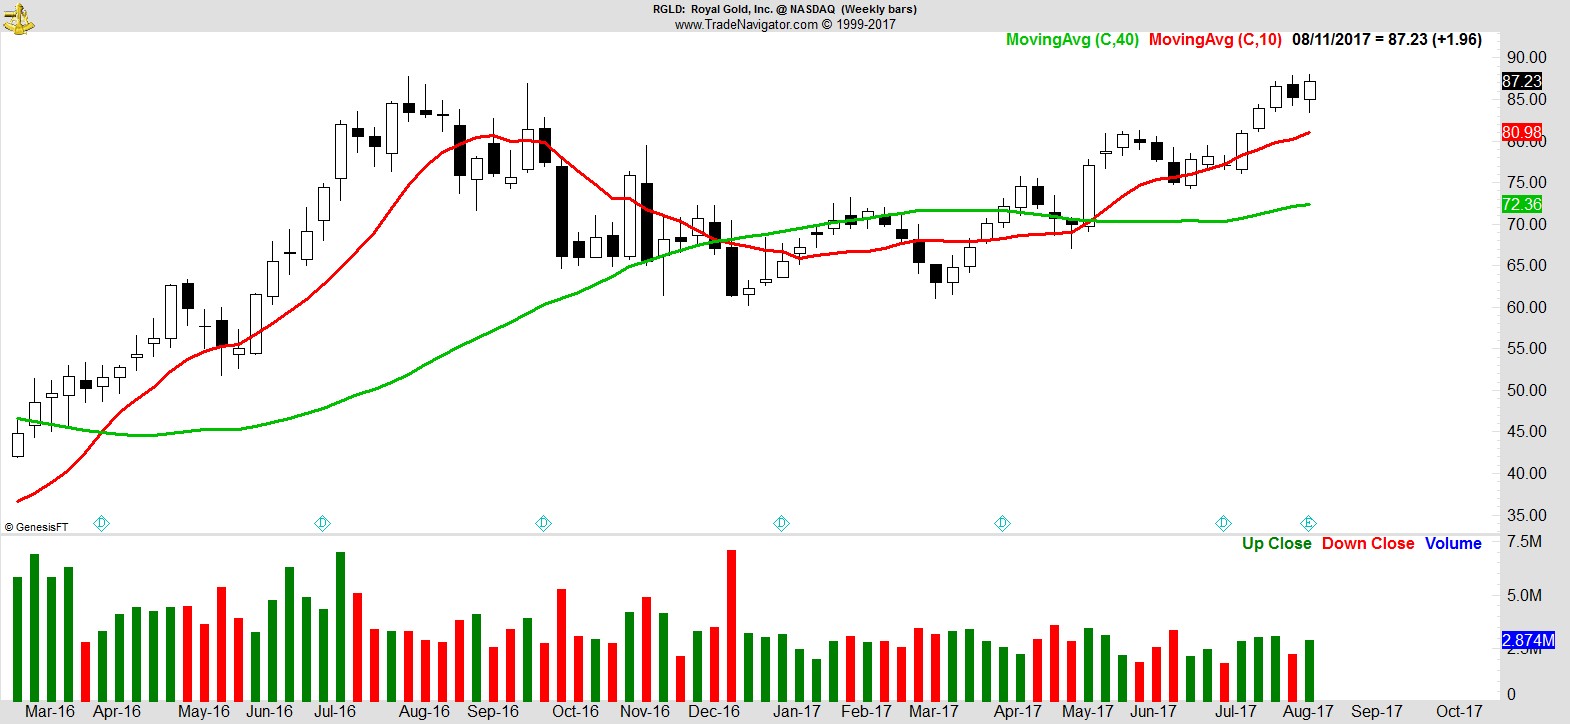
$RGLD
.
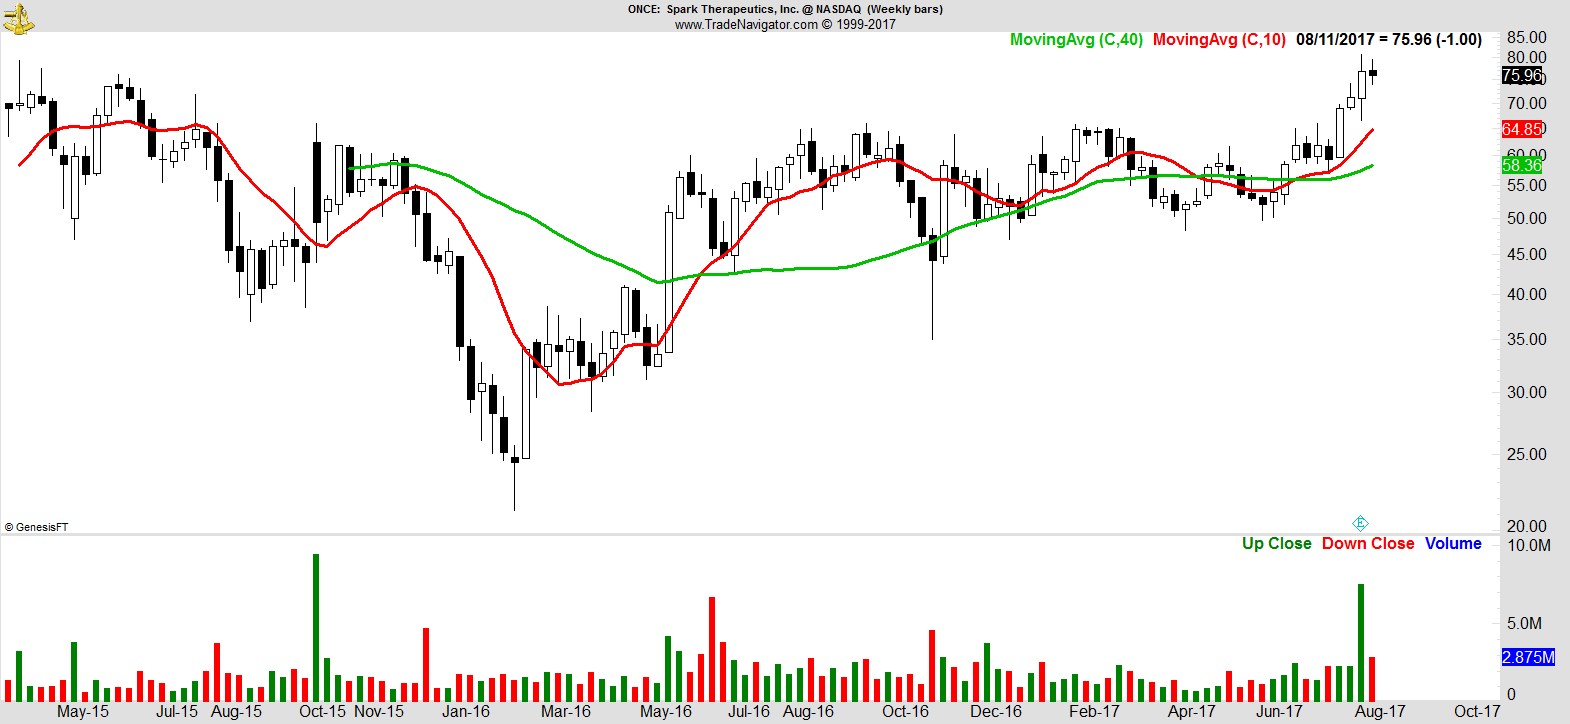
$ONCE
.
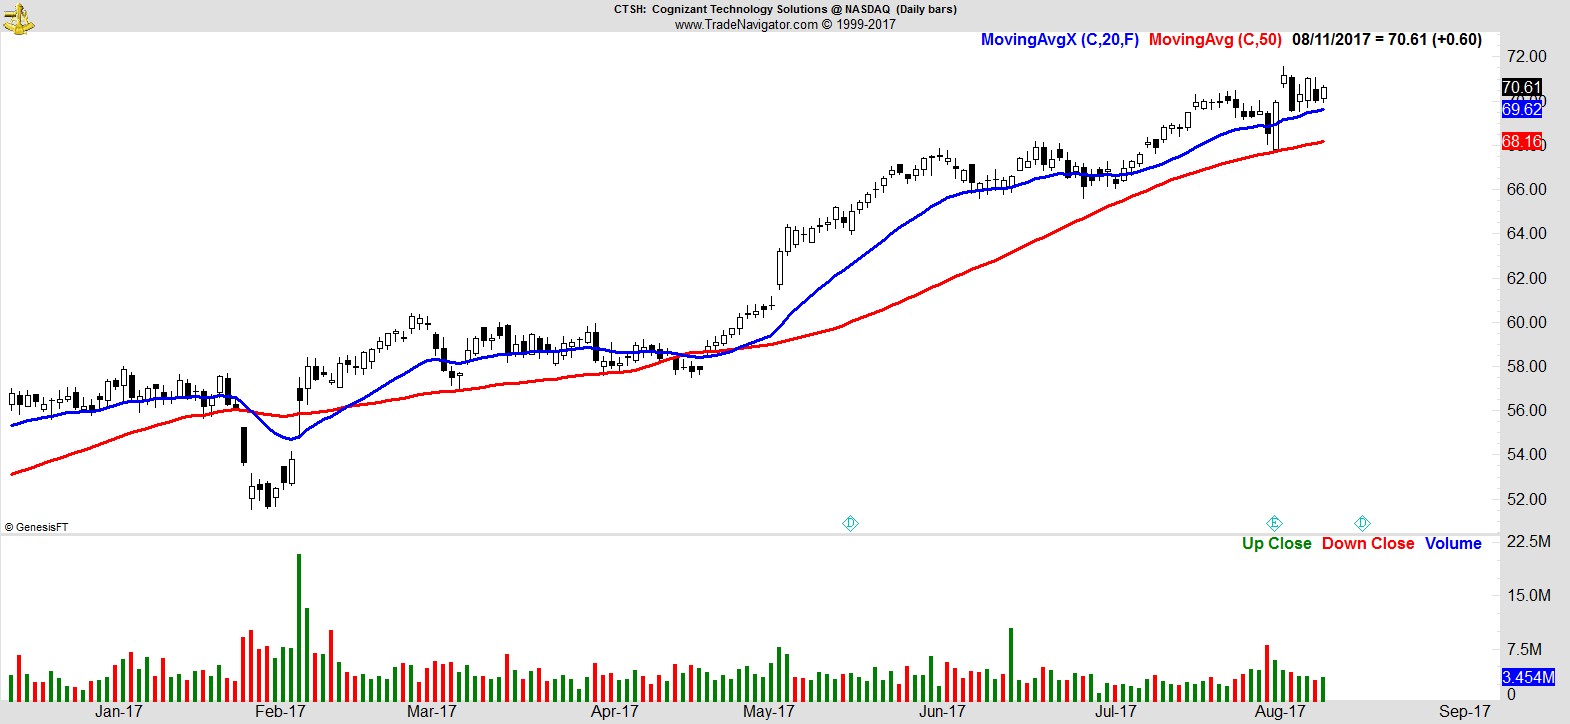
$CTSH
.
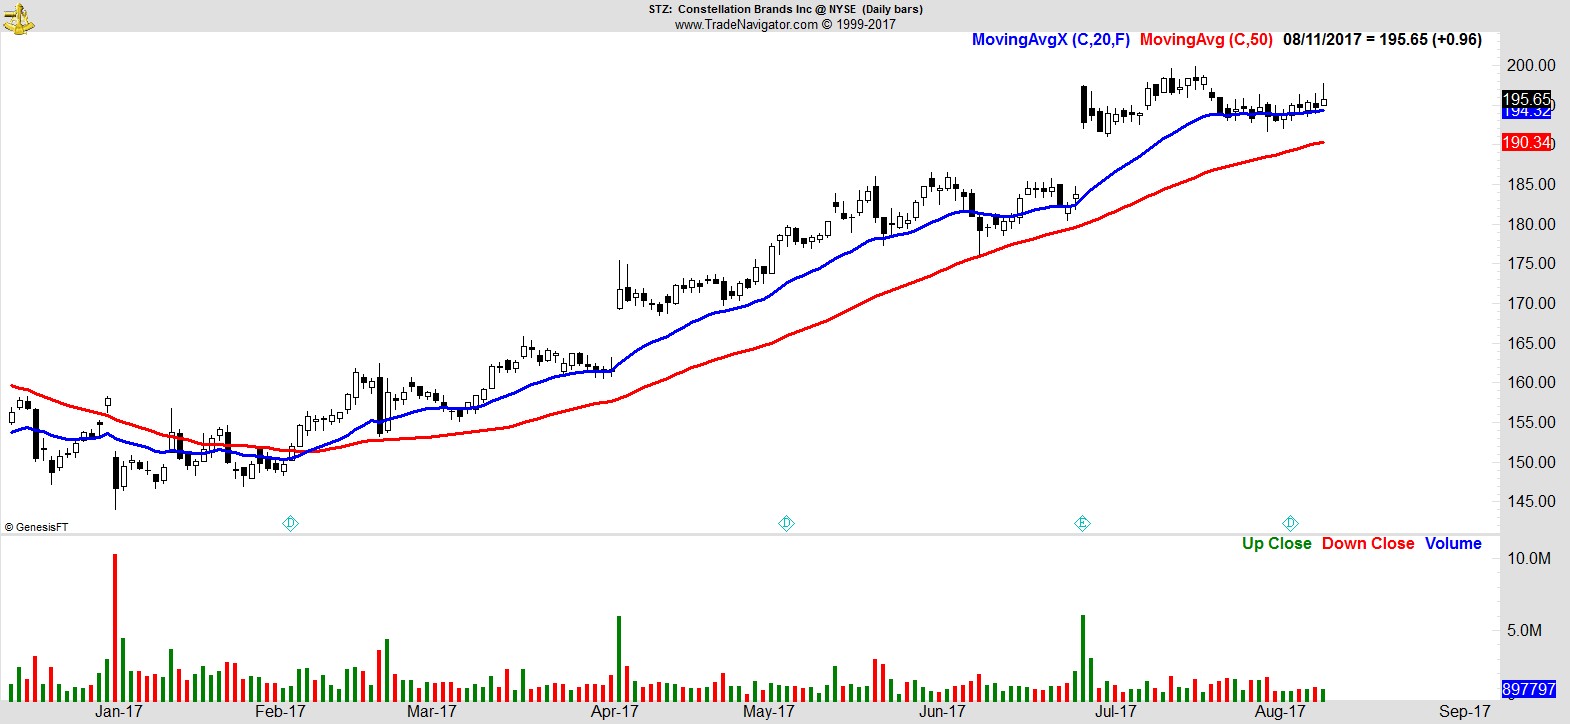
$STZ
.
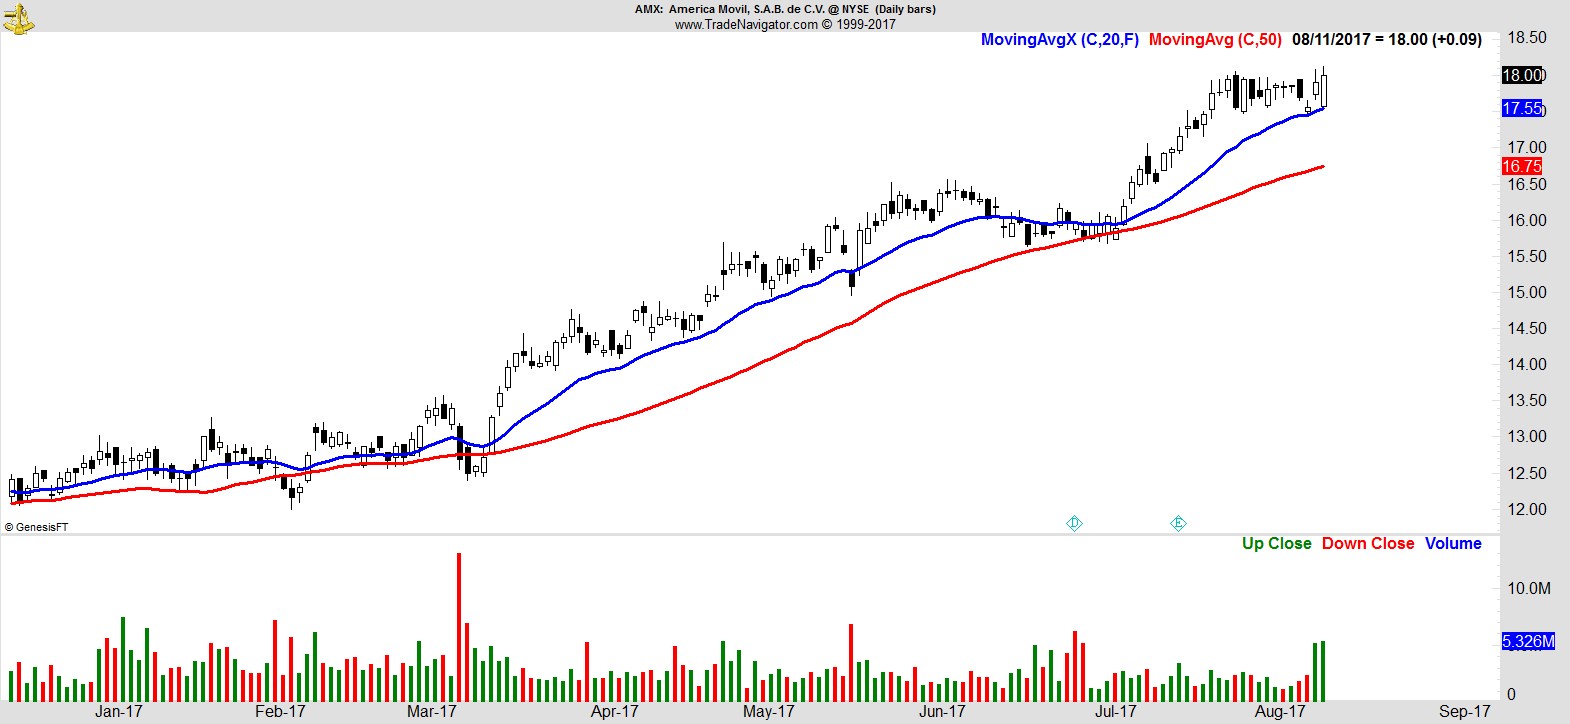
$AMX
.
Recent free content from Jon Boorman
-
 Weekend Review and Watchlist
— 9/30/17
-
 Weekend Review and Watchlist
— 9/22/17
-
 Weekend Review and Watchlist
— 9/17/17
-
 Weekend Review and Watchlist
— 9/10/17
-
 Weekend Review and Watchlist
— 9/02/17


